Note
Click here to download the full example code
Decode regions of interest and subsets of Datasets
We can use the methods in nimare.decode.discrete to apply functional
characterization analysis to regions of interest or subsets of the Dataset.
import os

import numpy as np
import nibabel as nib
from nilearn.plotting import plot_stat_map, plot_roi

import nimare
from nimare.decode import discrete
from nimare.tests.utils import get_test_data_path
Load dataset with abstracts
We’ll load a small dataset composed only of studies in Neurosynth with Angela Laird as a coauthor, for the sake of speed.
dset = nimare.dataset.Dataset.load(
    os.path.join(get_test_data_path(), 'neurosynth_laird_studies.pkl.gz'))
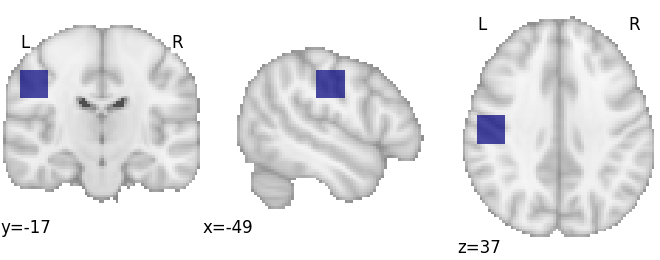
Create a region of interest
# First we'll make an ROI
arr = np.zeros(dset.masker.mask_img.shape, int)
arr[65:75, 50:60, 50:60] = 1
mask_img = nib.Nifti1Image(arr, dset.masker.mask_img.affine)
plot_roi(mask_img, draw_cross=False)

# Get studies with voxels in the mask
ids = dset.get_studies_by_mask(mask_img)
Decode an ROI image using the Neurosynth method
# Run the decoder
decoder = discrete.NeurosynthDecoder(correction=None)
decoder.fit(dset)
decoded_df = decoder.transform(ids=ids)
print(decoded_df.sort_values(by='probReverse', ascending=False).head(10))
Out:
                         pForward  zForward  ...  zReverse  probReverse
Term                                         ...
motor                2.779546e-08  5.554784  ...  2.962263     1.000000
presence             2.553341e-04  3.656850  ...  2.806918     0.916667
behavioral           3.583888e-04  3.568969  ...  2.043146     0.869565
primary              3.583888e-04  3.568969  ...  2.043146     0.869565
finally              9.176489e-02  1.686161  ...  1.900292     0.857143
showing              9.176489e-02  1.686161  ...  1.900292     0.857143
shift                9.176489e-02  1.686161  ...  1.900292     0.857143
supplementary        9.176489e-02  1.686161  ...  1.900292     0.857143
supplementary motor  9.176489e-02  1.686161  ...  1.900292     0.857143
pet                  9.176489e-02  1.686161  ...  1.900292     0.857143

[10 rows x 6 columns]
Decode an ROI image using the BrainMap method
# Run the decoder
decoder = discrete.BrainMapDecoder(correction=None)
decoder.fit(dset)
decoded_df = decoder.transform(ids=ids)
print(decoded_df.sort_values(by='probReverse', ascending=False).head(10))
Out:
                  pForward  zForward  ...  zReverse  probReverse
Term                                  ...
critical               1.0       0.0  ...       0.0     0.025862
communication          1.0       0.0  ...       0.0     0.025862
correction             1.0       0.0  ...       0.0     0.025862
pitch                  1.0       0.0  ...       0.0     0.025862
tasks                  1.0       0.0  ...       0.0     0.025862
critical role          1.0       0.0  ...       0.0     0.025862
inferior frontal       1.0       0.0  ...       0.0     0.025862
gyrus                  1.0       0.0  ...       0.0     0.025862
detection              1.0       0.0  ...       0.0     0.025862
goal                   1.0       0.0  ...       0.0     0.025862

[10 rows x 6 columns]
Total running time of the script: ( 0 minutes 1.851 seconds)