Summary
Dataset 1
- Number of studies: 21
- Number of experiments: 21
- Number of experiments included: 21
- Number of foci: 262
- Number of foci outside the mask: 0
Experiments excluded
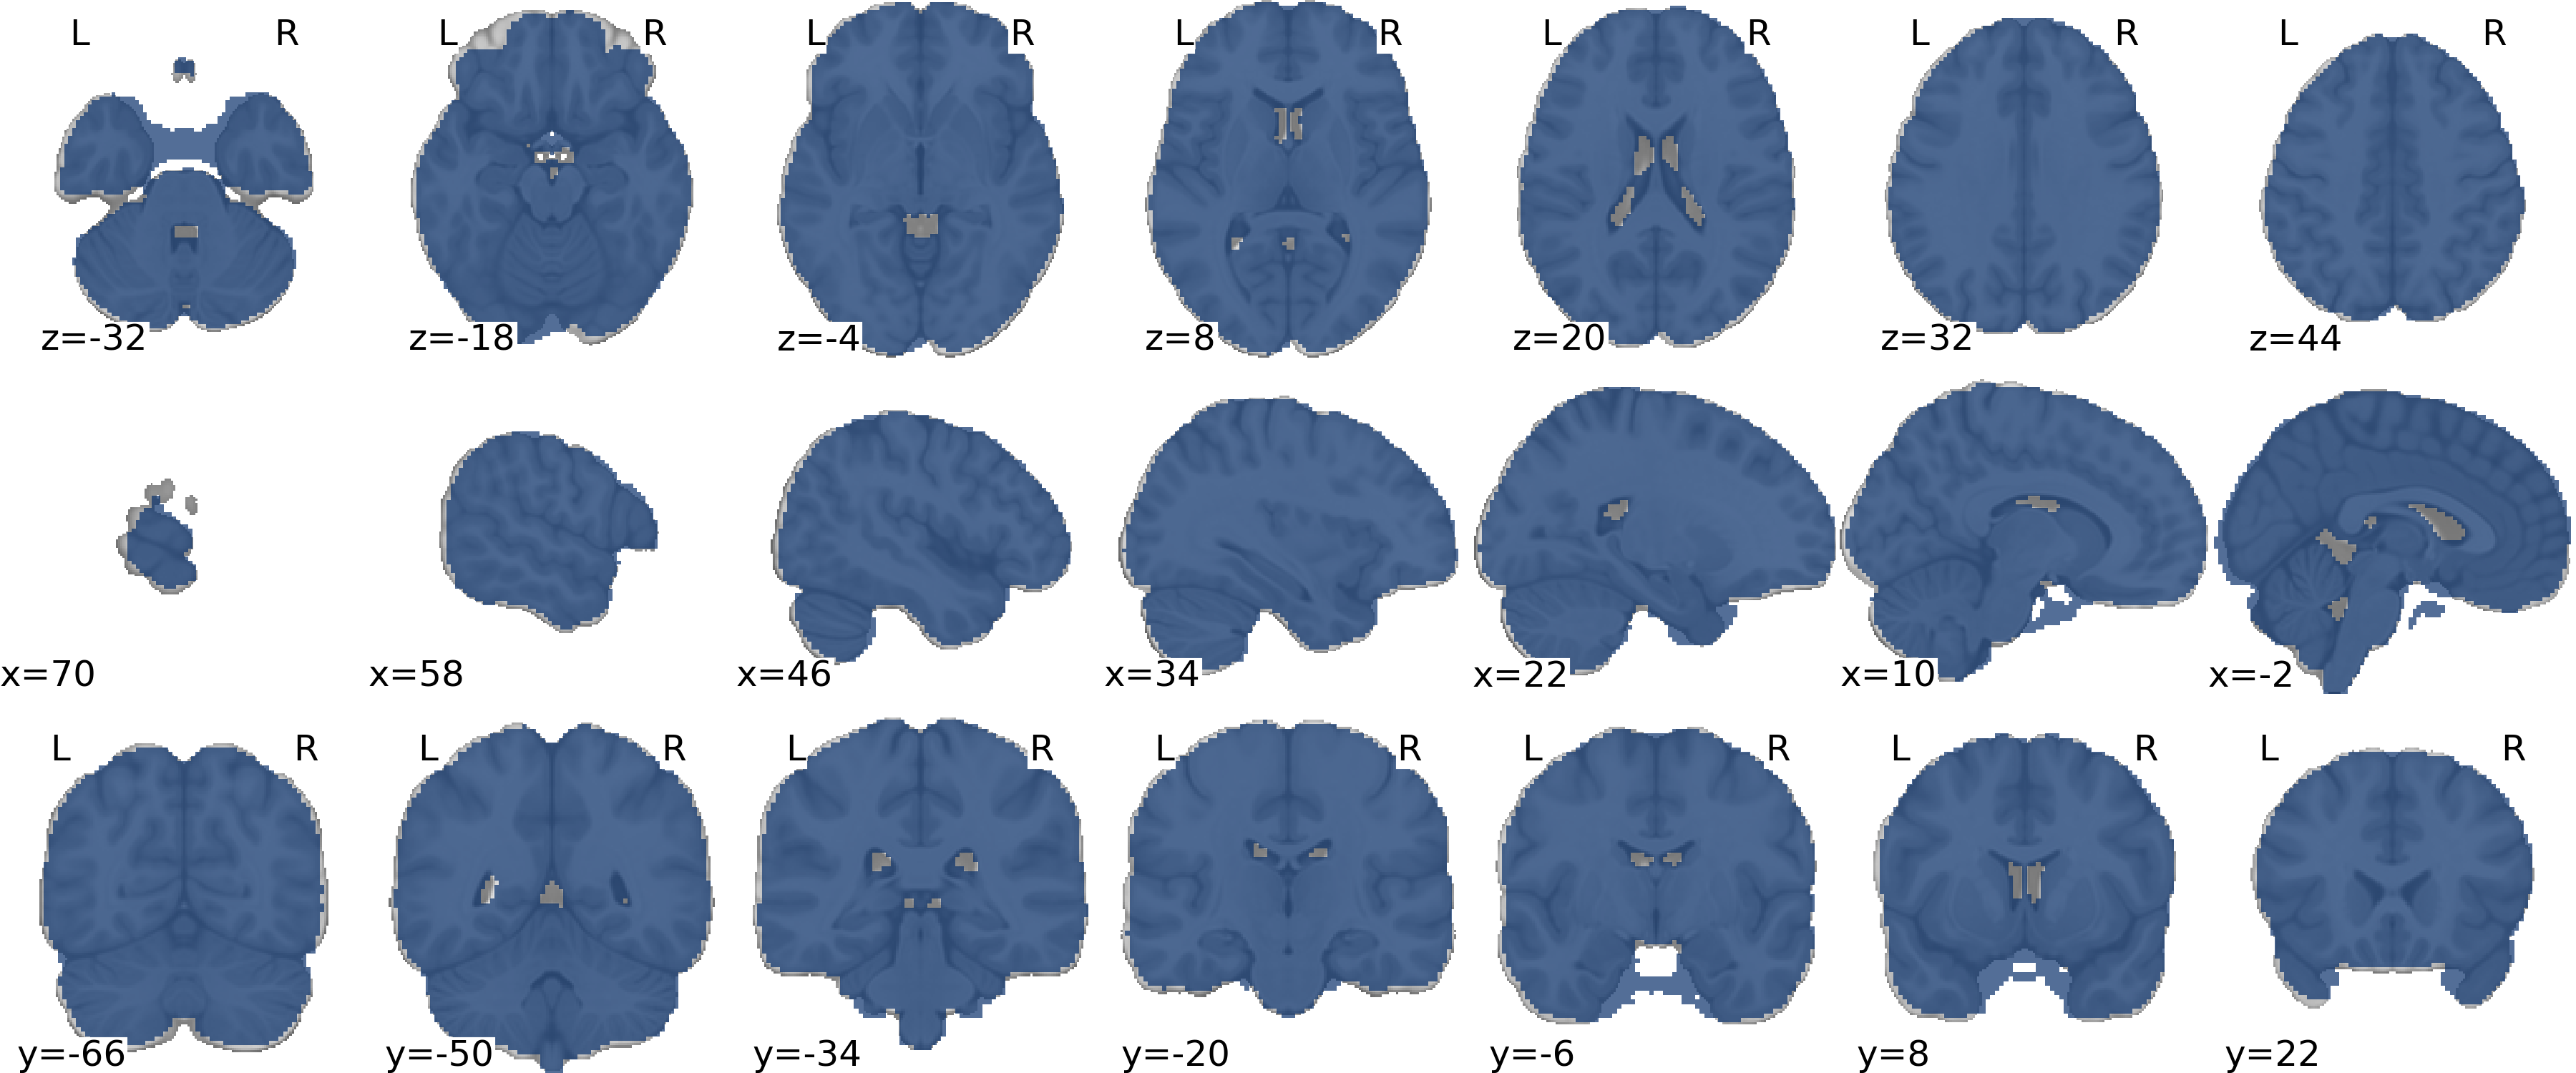
Mask
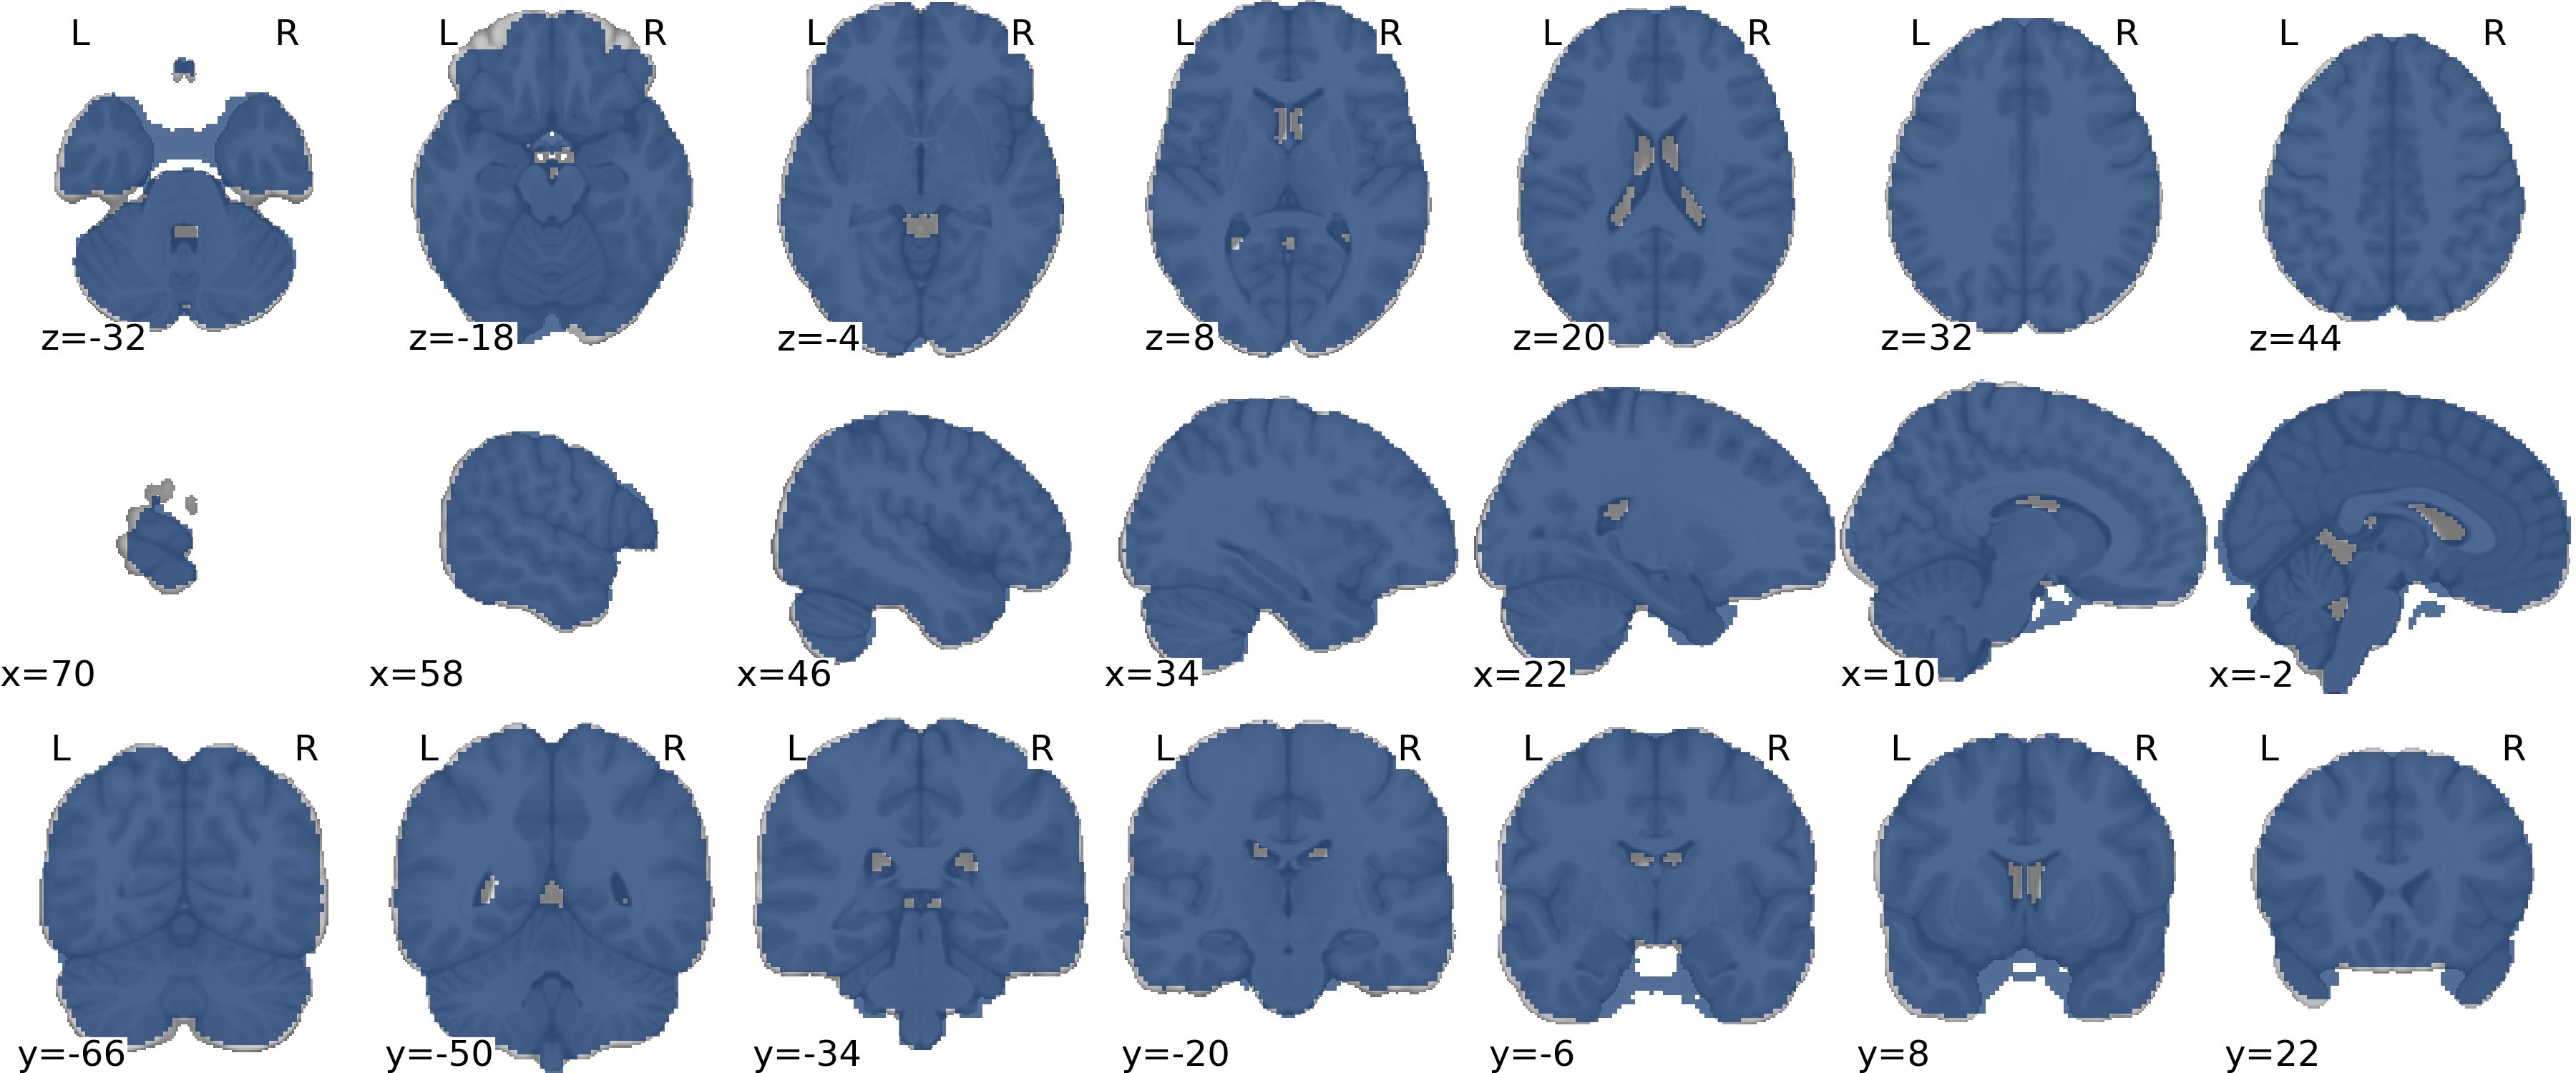
Get figure file: figures/preliminary_dset-1_figure-mask.png
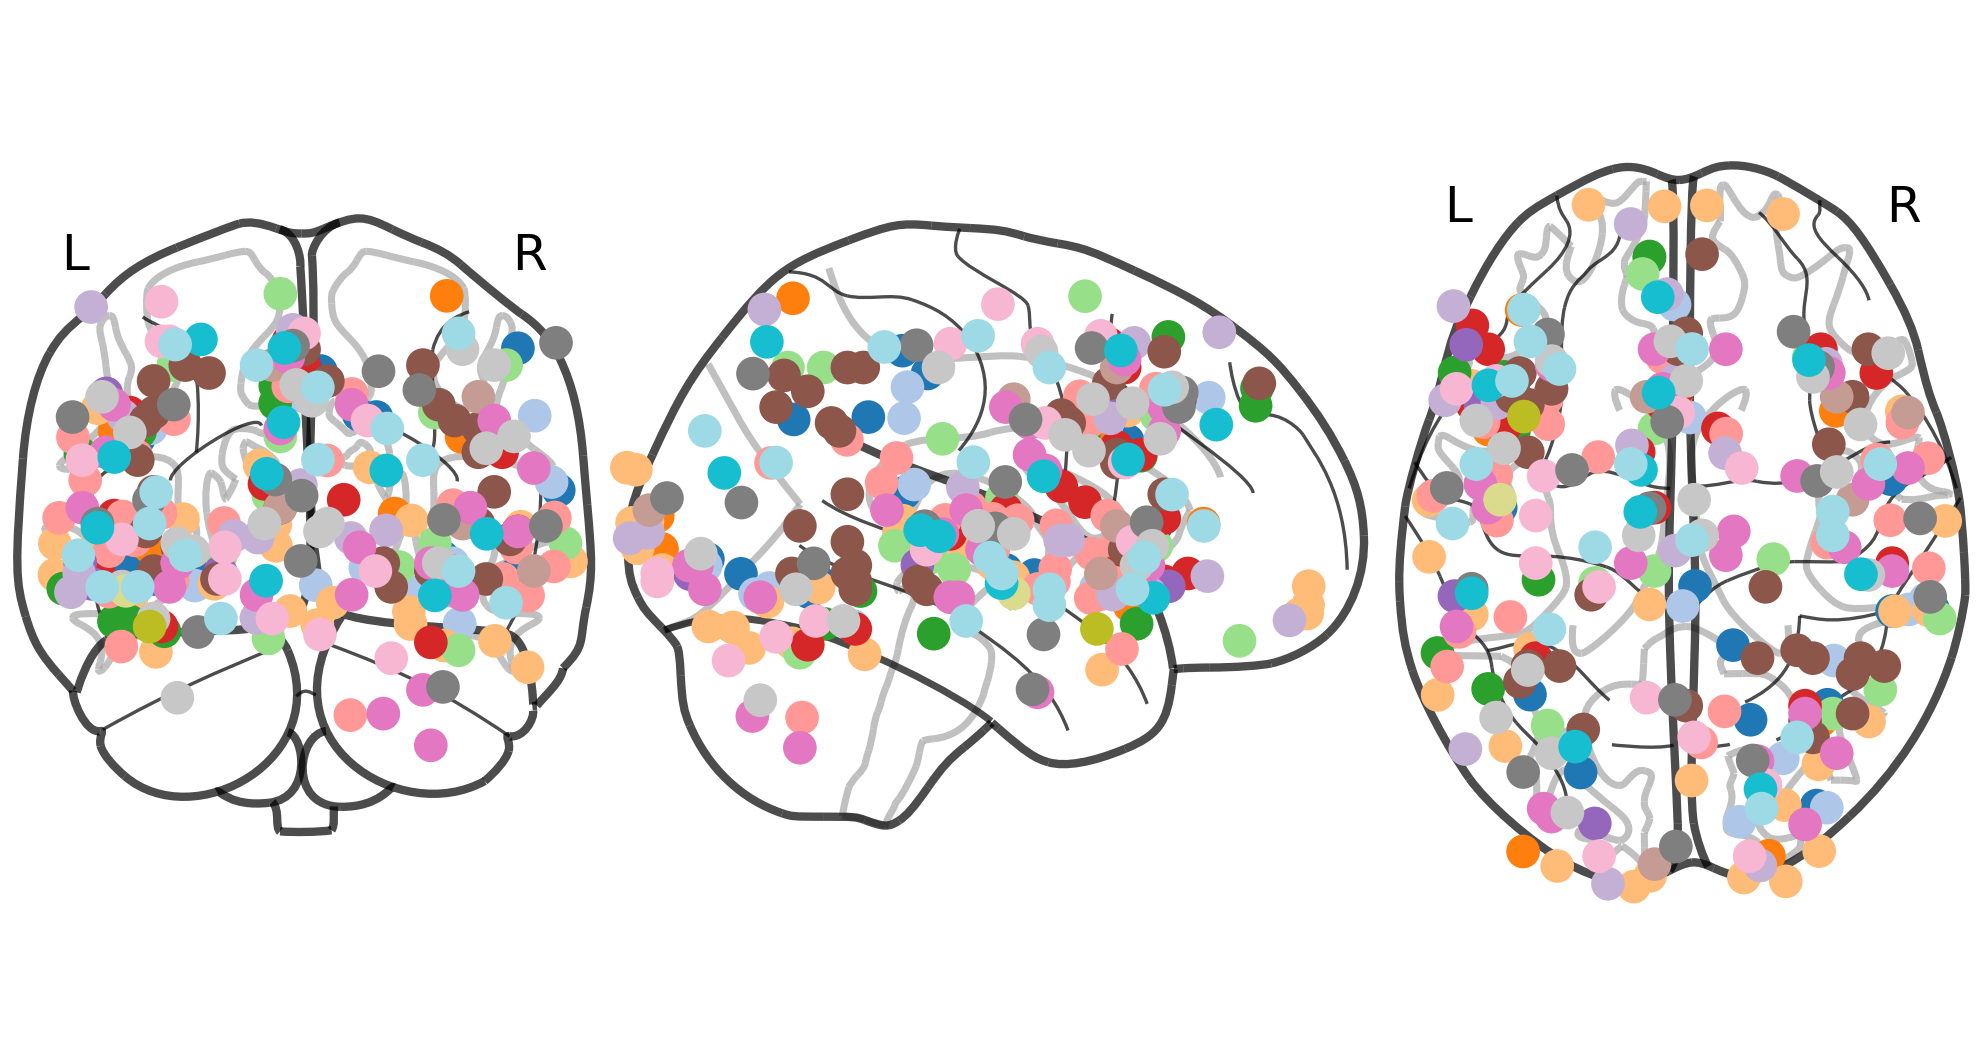
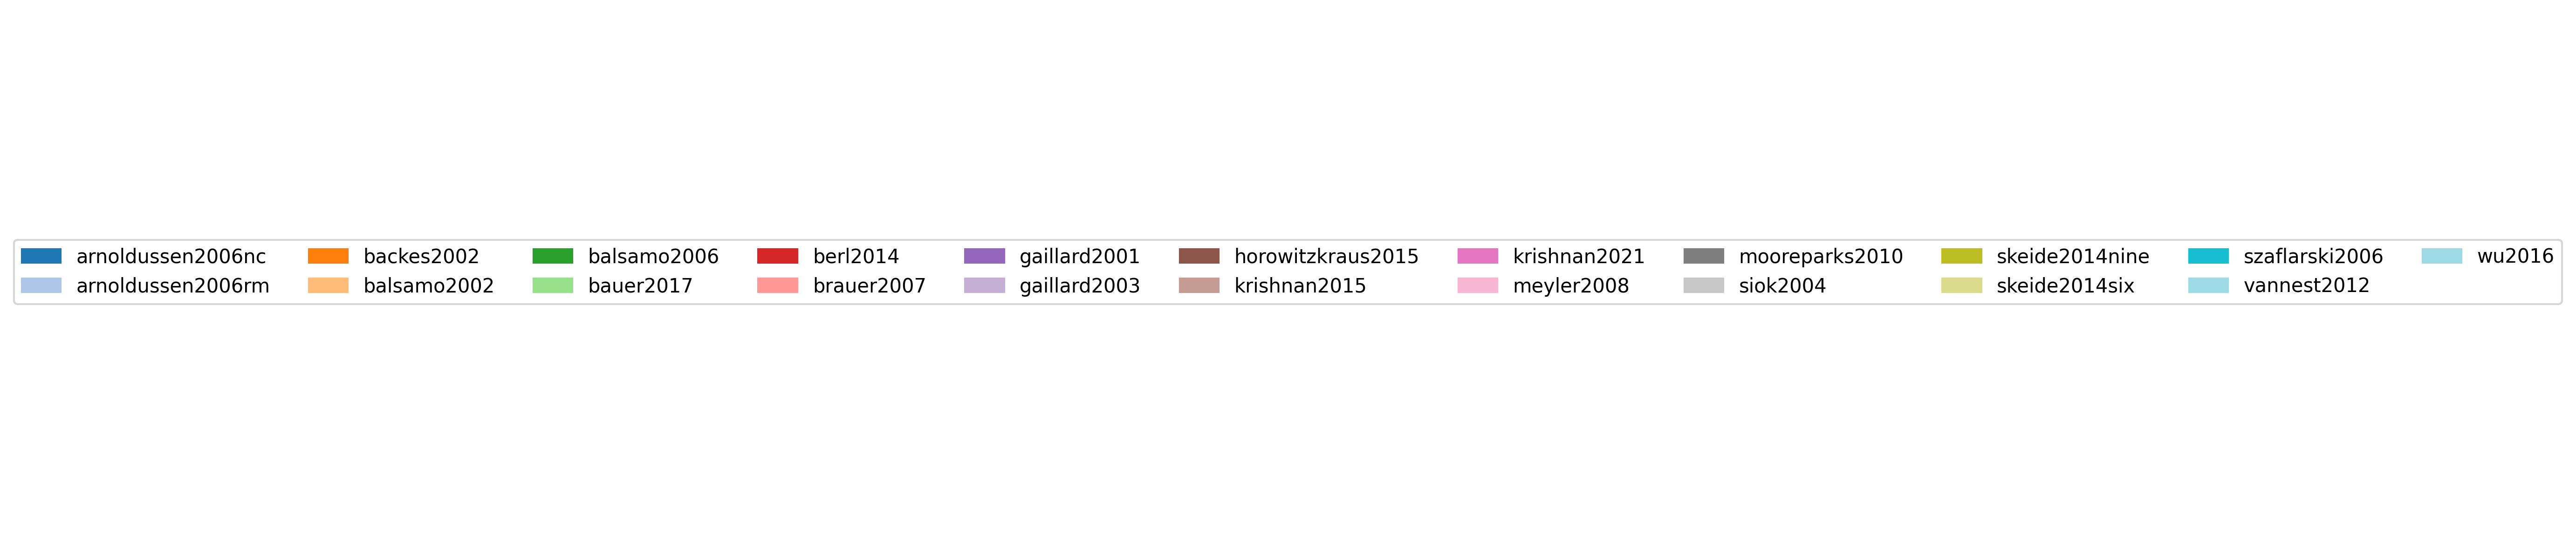
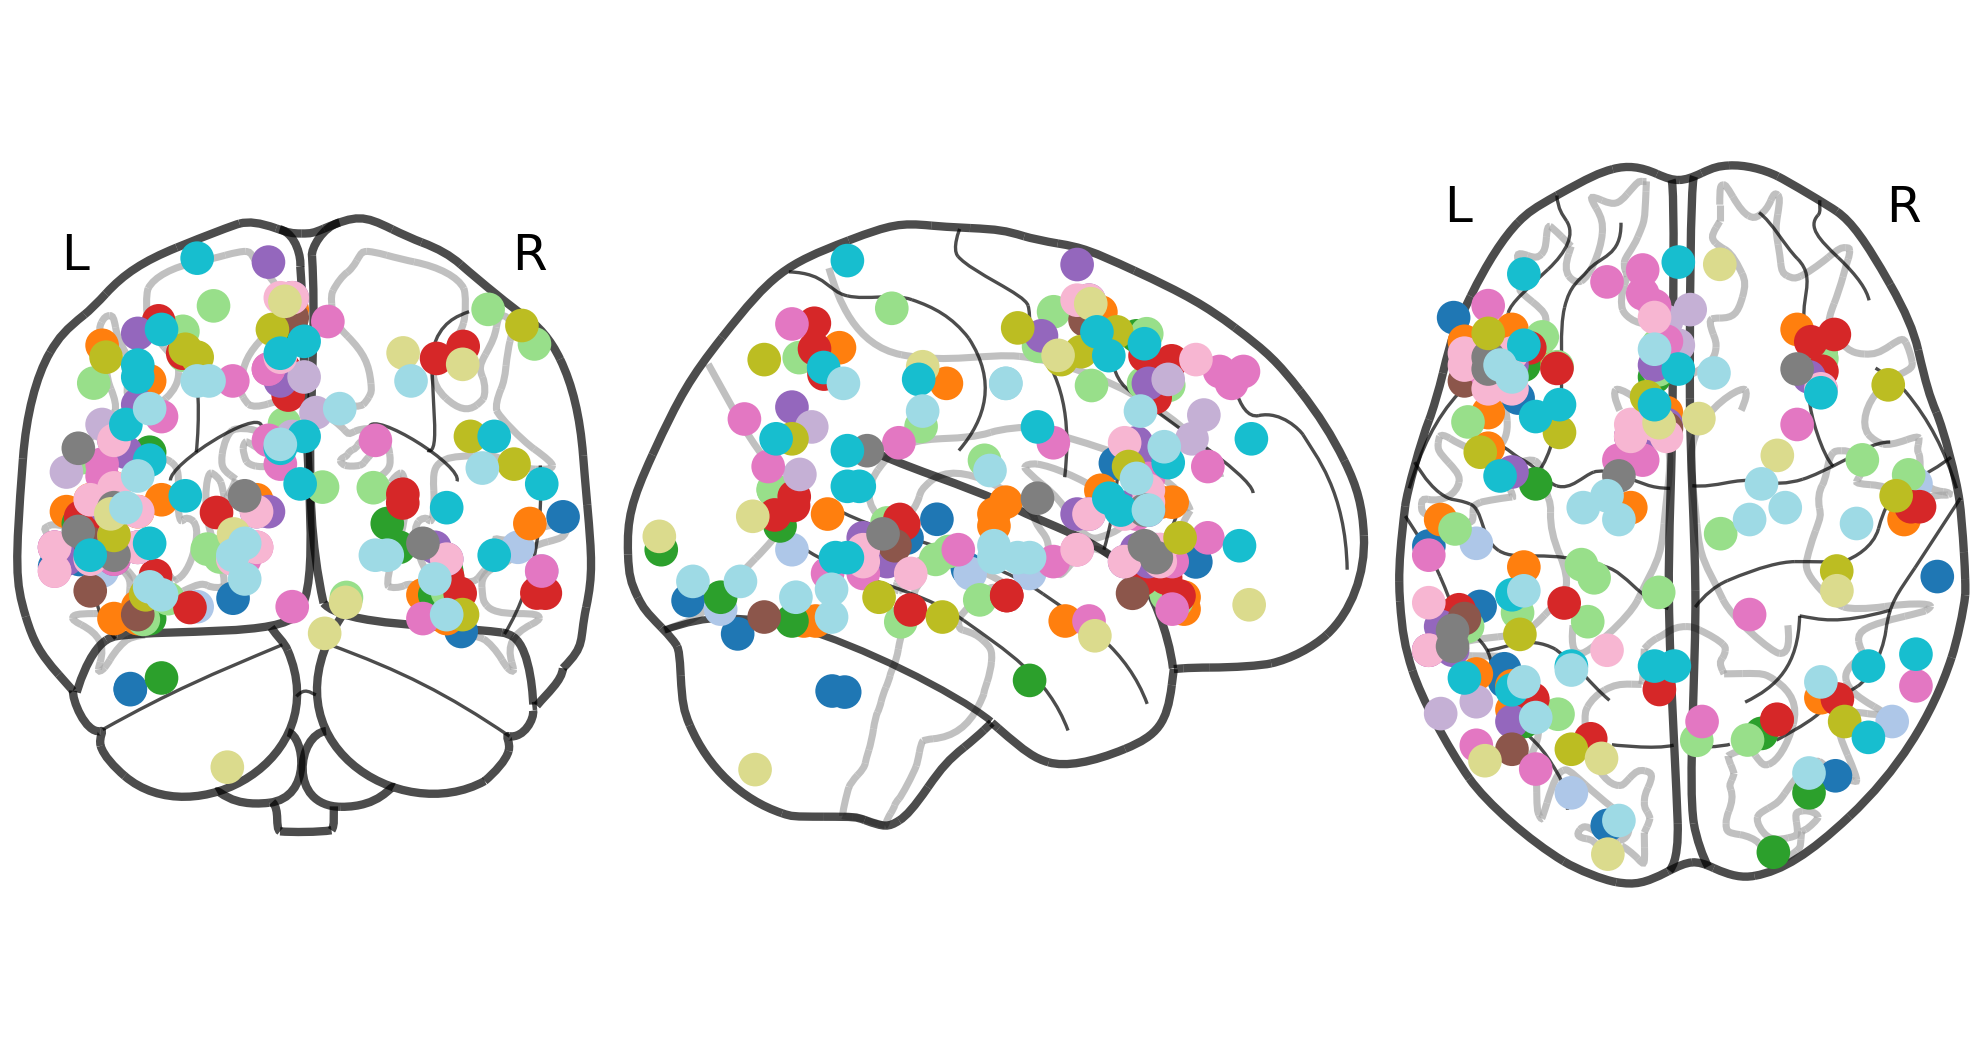

Parameters use to fit the meta-analytic estimator.
Parameters use to fit the corrector.
The following figure provides an interactive window to explore the meta-analytic map in detail.
This panel shows the the corrrected meta-analytic map.
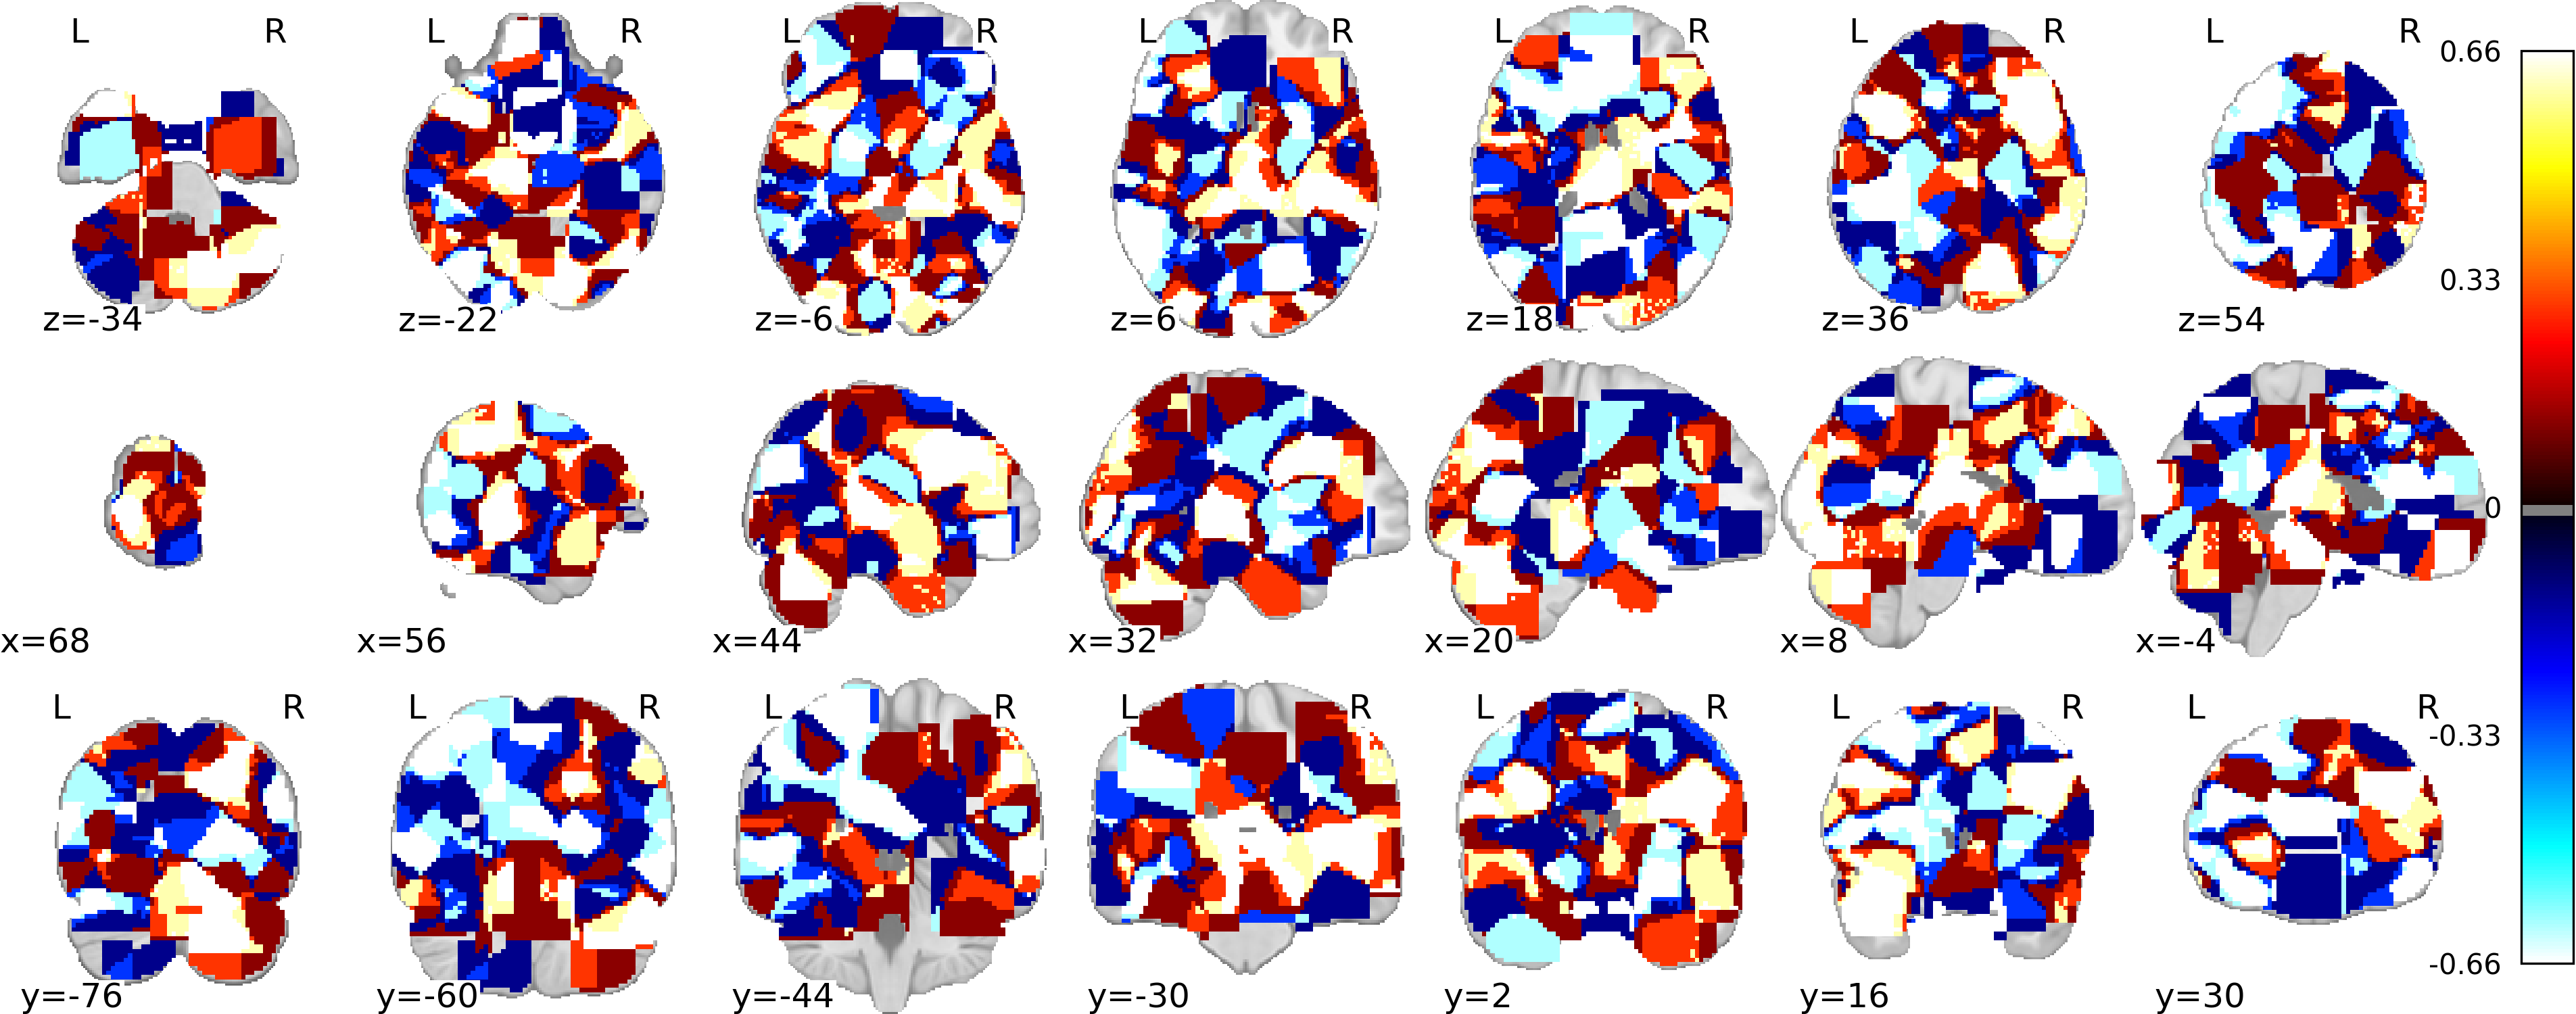
| X | Y | Z | Peak Stat | Cluster Size (mm3) | ||
|---|---|---|---|---|---|---|
| Tail | Cluster ID | |||||
| Positive | 1 | 38.00 | -12.00 | -42.00 | 2.58 | 856448 |
| 1a | -46.00 | 16.00 | -36.00 | 2.58 | ||
| 1b | -44.00 | 48.00 | 22.00 | 2.58 | ||
| 1c | 38.00 | -10.00 | -48.00 | 2.58 | ||
| 2 | 38.00 | -70.00 | -54.00 | 2.58 | 168 | |
| 3 | 38.00 | -60.00 | -56.00 | 2.58 | 168 | |
| 4 | -36.00 | 60.00 | -10.00 | 0.47 | 120 | |
| 5 | -38.00 | -8.00 | 62.00 | 0.13 | 112 | |
| 6 | -38.00 | -82.00 | -30.00 | 0.13 | 112 | |
| 7 | -64.00 | -52.00 | 26.00 | 0.10 | 152 | |
| Negative | 11 | -4.00 | -72.00 | 62.00 | -2.58 | 832832 |
| 11a | -50.00 | -52.00 | 50.00 | -2.58 | ||
| 11b | -50.00 | -68.00 | 44.00 | -2.58 | ||
| 11c | -40.00 | -48.00 | -52.00 | -2.58 | ||
| 12 | 60.00 | 22.00 | 8.00 | -0.44 | 3520 | |
| 12a | 52.00 | 14.00 | 10.00 | -0.36 | ||
| 12b | 60.00 | 14.00 | 16.00 | -0.33 | ||
| 12c | 60.00 | 16.00 | 28.00 | -0.33 | ||
| 13 | 32.00 | -14.00 | 72.00 | -0.36 | 216 | |
| 13a | 36.00 | -26.00 | 70.00 | -0.05 | ||
| 14 | 26.00 | -98.00 | 0.00 | -0.28 | 608 | |
| 15 | -56.00 | 8.00 | -22.00 | -0.23 | 144 | |
| 16 | -6.00 | -60.00 | -22.00 | -0.23 | 120 | |
| 17 | 30.00 | 40.00 | 8.00 | -0.20 | 112 | |
| 17a | 22.00 | 42.00 | 8.00 | -0.20 | ||
| 18 | 56.00 | 2.00 | -34.00 | -0.20 | 248 | |
| 19 | 0.00 | -44.00 | 6.00 | -0.20 | 128 | |
| 20 | -12.00 | 54.00 | 2.00 | -0.20 | 120 | |
| 21 | 14.00 | -60.00 | -44.00 | -0.18 | 208 | |
| 22 | 2.00 | -82.00 | 32.00 | -0.18 | 504 | |
| 22a | 0.00 | -84.00 | 20.00 | -0.10 | ||
| 23 | 10.00 | -32.00 | 60.00 | -0.15 | 224 | |
| 24 | 36.00 | -66.00 | -52.00 | -0.10 | 2776 | |
| 25 | 72.00 | -30.00 | -4.00 | -0.10 | 104 | |
| 26 | 66.00 | -10.00 | 26.00 | -0.10 | 80 | |
| 27 | 26.00 | -82.00 | -48.00 | -0.10 | 80 | |
| 28 | 20.00 | -84.00 | -46.00 | -0.10 | 112 | |
| 29 | 38.00 | -58.00 | -56.00 | -0.10 | 112 | |
| 30 | 30.00 | 46.00 | 34.00 | -0.05 | 760 | |
| 31 | -14.00 | -26.00 | -32.00 | -0.05 | 256 | |
| 32 | -34.00 | -74.00 | 10.00 | -0.05 | 80 |
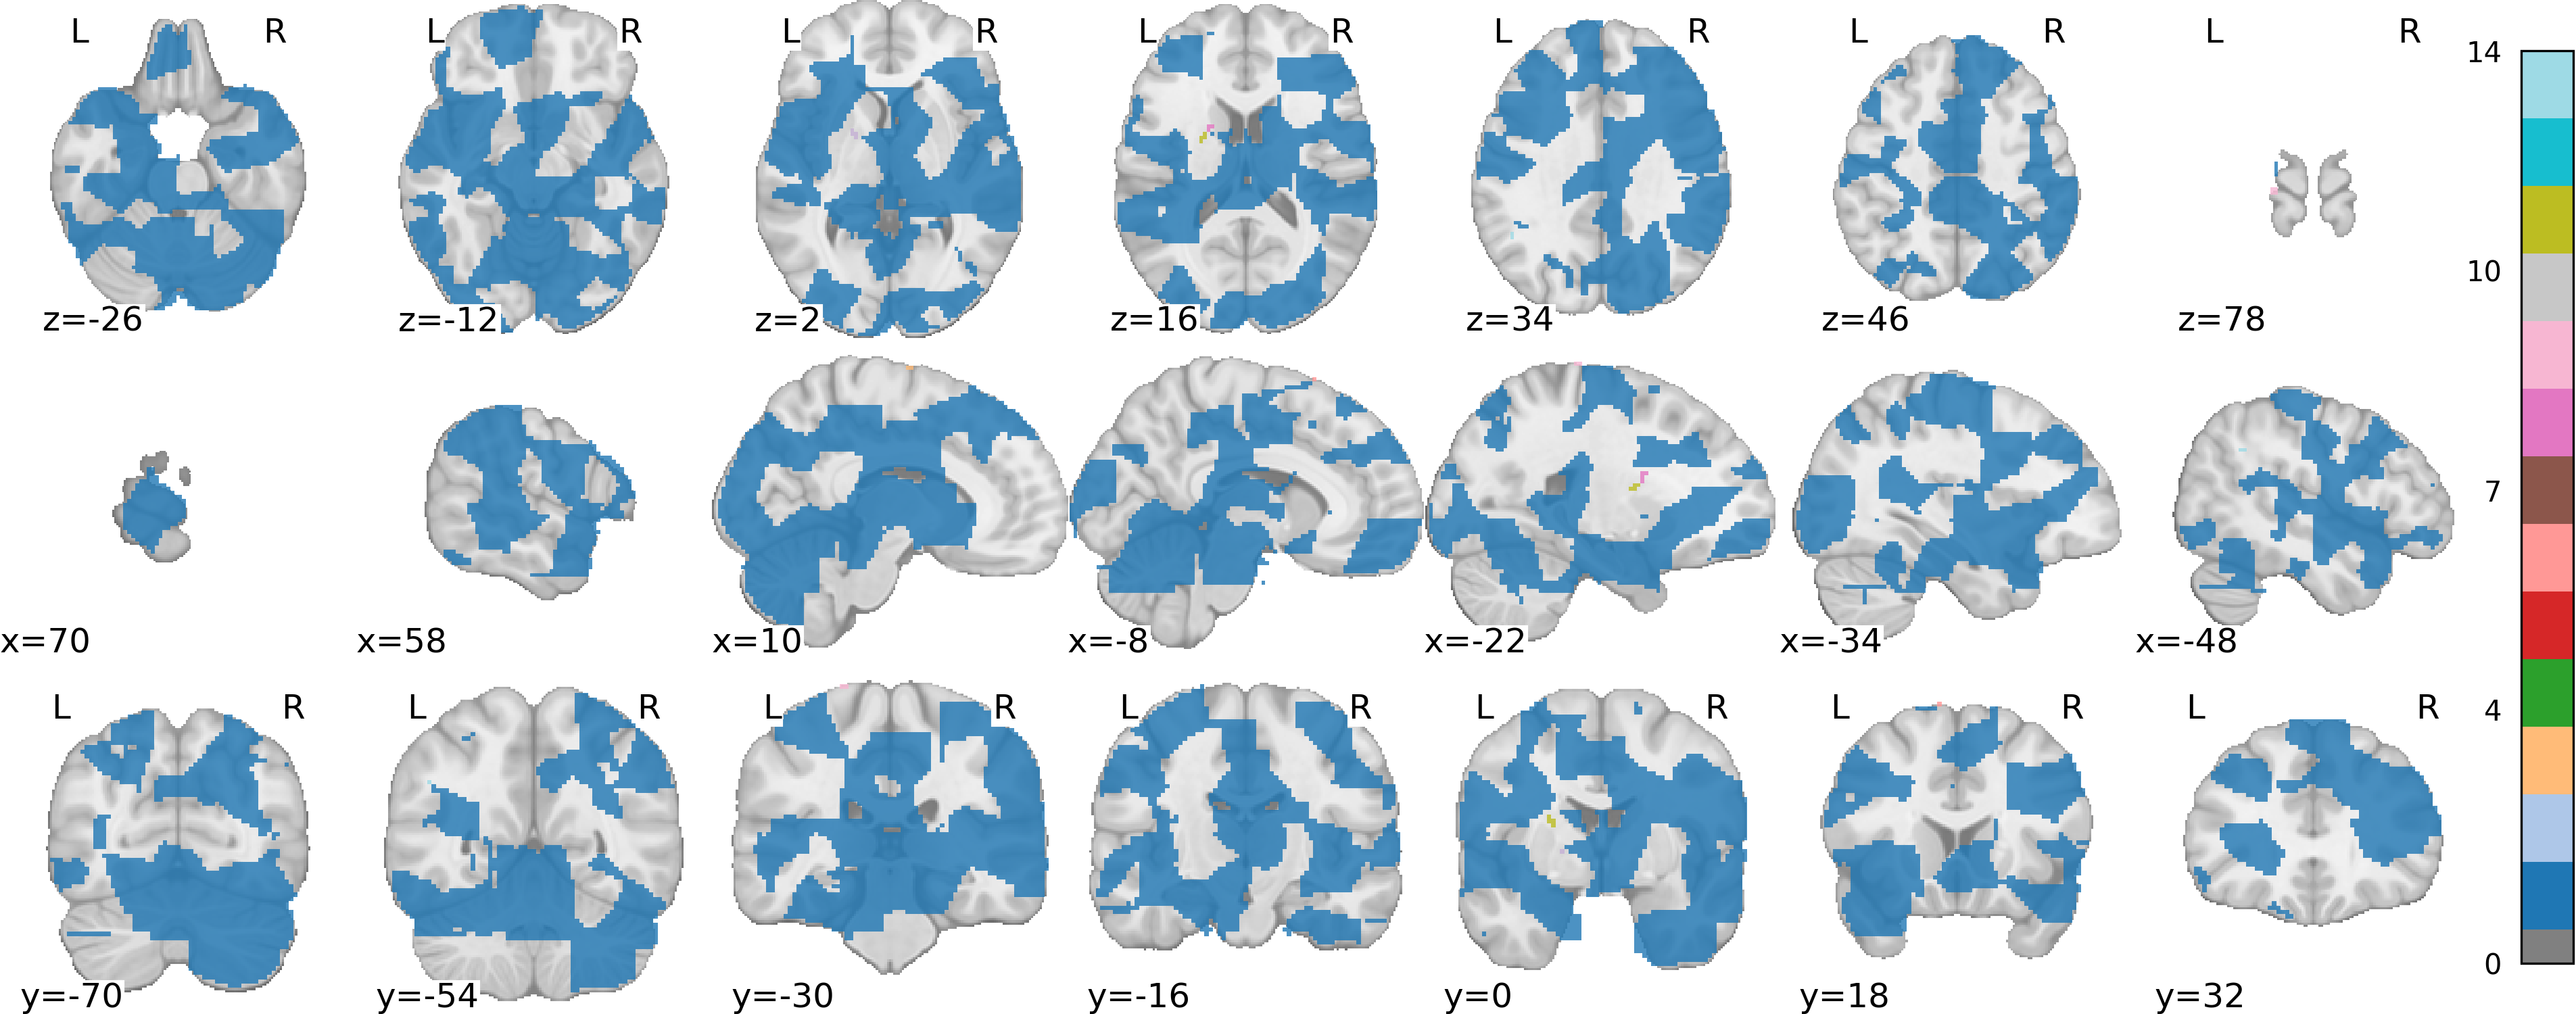
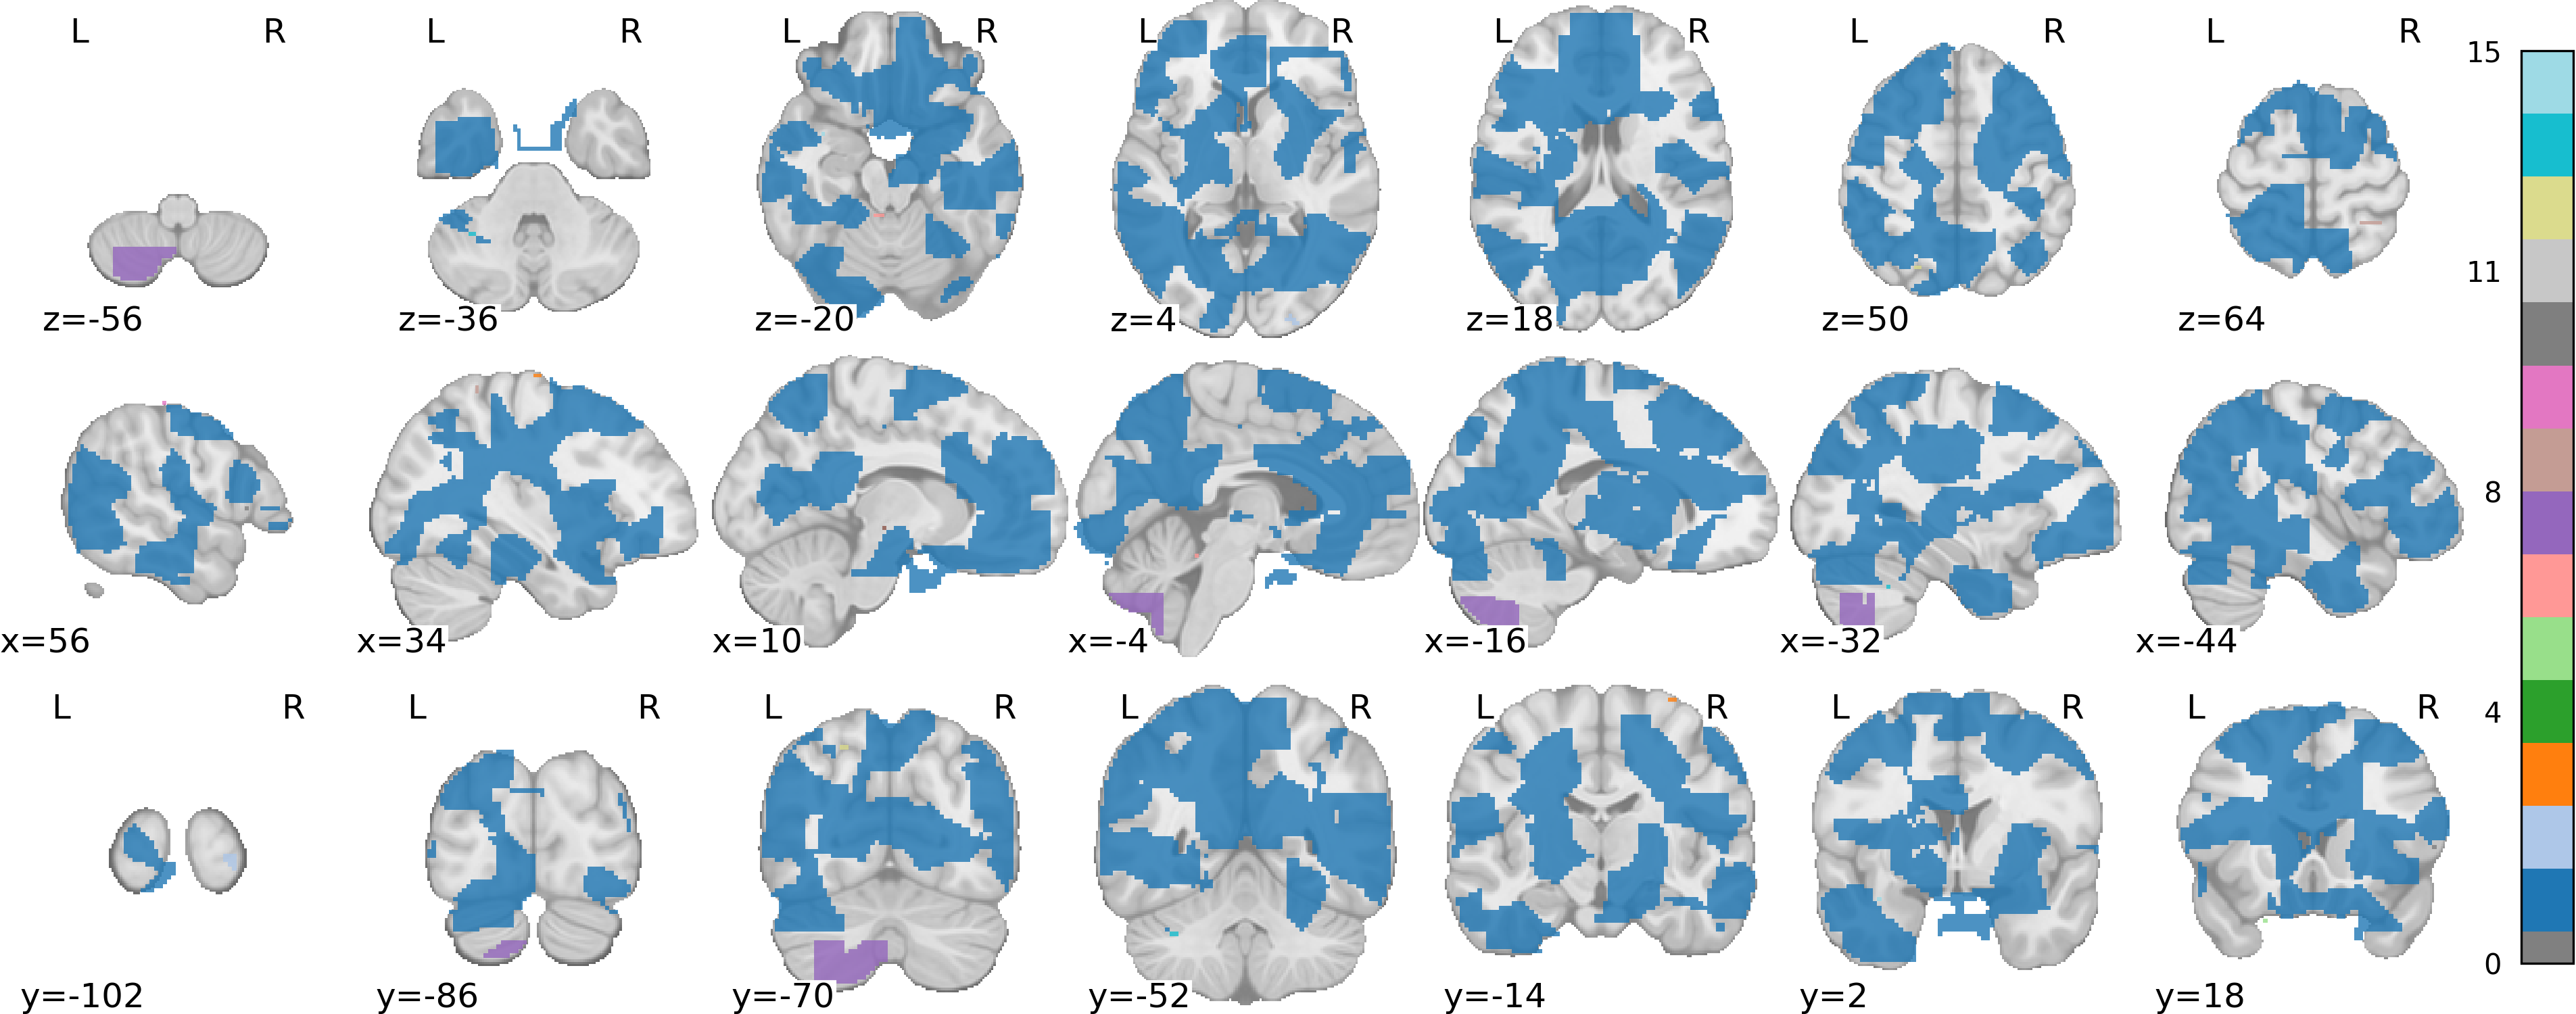
The FocusCounter analysis characterizes the relative contribution of each experiment in a meta-analysis to the resulting clusters by counting the number of peaks from each experiment that fall within each significant cluster.
The heatmap presents the relative contributions of each experiment to each cluster in the thresholded map. There is one row for each experiment, and one column for each cluster, with column names being PostiveTail/NegativeTail indicating the sign (+/-) of the cluster's statistical values. The rows and columns were re-ordered to form clusters in the heatmap.
We kindly ask to report results preprocessed with this tool using the following boilerplate.
An activation likelihood estimation (ALE) subtraction analysis
\citep{laird2005ale,eickhoff2012activation} was performed with NiMARE v0.20.0+5.g605e03f
(RRID:SCR_017398; \citealt{Salo2023}), using a(n) ALE kernel. An ALE kernel
\citep{eickhoff2012activation} was used to generate study-wise modeled activation maps from
coordinates. In this kernel method, each coordinate is convolved with a Gaussian kernel with full-
width at half max values determined on a study-wise basis based on the study sample sizes according
to the formulae provided in \cite{eickhoff2012activation}. For voxels with overlapping kernels, the
maximum value was retained. The subtraction analysis was implemented according to NiMARE's
\citep{Salo2023} approach, which differs from the original version. In this version, ALE-difference
scores are calculated between the two datasets, for all voxels in the mask, rather than for voxels
significant in the main effects analyses of the two datasets. Next, voxel-wise null distributions
of ALE-difference scores were generated via a randomized group assignment procedure, in which the
studies in the two datasets were randomly reassigned and ALE-difference scores were calculated for
the randomized datasets. This randomization procedure was repeated 100 times to build the null
distributions. The significance of the original ALE-difference scores was assessed using a two-
sided statistical test. The null distributions were assumed to be asymmetric, as ALE-difference
scores will be skewed based on the sample sizes of the two datasets. The first input dataset
(group1) included 262 foci from 21 experiments, with a total of 456 participants. The second input
dataset (group2) included 201 foci from 16 experiments, with a total of 353 participants. Family-
wise error correction was performed using voxel-level and cluster-level Monte Carlo procedures for
ALE subtraction. In this procedure, experiments from the two input datasets were randomly
reassigned between groups while preserving the original group sizes, and the maximum absolute ALE-
difference value, cluster size, and cluster mass were retained. This procedure was repeated 100
times to build null distributions of summary statistics, cluster sizes, and cluster masses.
Clusters were defined with face-wise connectivity at p < 0.01.
@article{Salo2023,
doi = {10.52294/001c.87681},
url = {https://doi.org/10.52294/001c.87681},
year = {2023},
volume = {3},
pages = {1 - 32},
author = {Taylor Salo and Tal Yarkoni and Thomas E. Nichols and Jean-Baptiste Poline and Murat Bilgel and Katherine L. Bottenhorn and Dorota Jarecka and James D. Kent and Adam Kimbler and Dylan M. Nielson and Kendra M. Oudyk and Julio A. Peraza and Alexandre Pérez and Puck C. Reeders and Julio A. Yanes and Angela R. Laird},
title = {NiMARE: Neuroimaging Meta-Analysis Research Environment},
journal = {Aperture Neuro}
}
@article{eickhoff2012activation,
title={Activation likelihood estimation meta-analysis revisited},
author={Eickhoff, Simon B and Bzdok, Danilo and Laird, Angela R and Kurth, Florian and Fox, Peter T},
journal={Neuroimage},
volume={59},
number={3},
pages={2349--2361},
year={2012},
publisher={Elsevier},
url={https://doi.org/10.1016/j.neuroimage.2011.09.017},
doi={10.1016/j.neuroimage.2011.09.017}
}
@article{laird2005ale,
title={ALE meta-analysis: Controlling the false discovery rate and performing statistical contrasts},
author={Laird, Angela R and Fox, P Mickle and Price, Cathy J and Glahn, David C and Uecker, Angela M and Lancaster, Jack L and Turkeltaub, Peter E and Kochunov, Peter and Fox, Peter T},
journal={Human brain mapping},
volume={25},
number={1},
pages={155--164},
year={2005},
publisher={Wiley Online Library},
url={https://doi.org/10.1002/hbm.20136},
doi={10.1002/hbm.20136}
}