Summary

Dataset 1

Experiments excluded
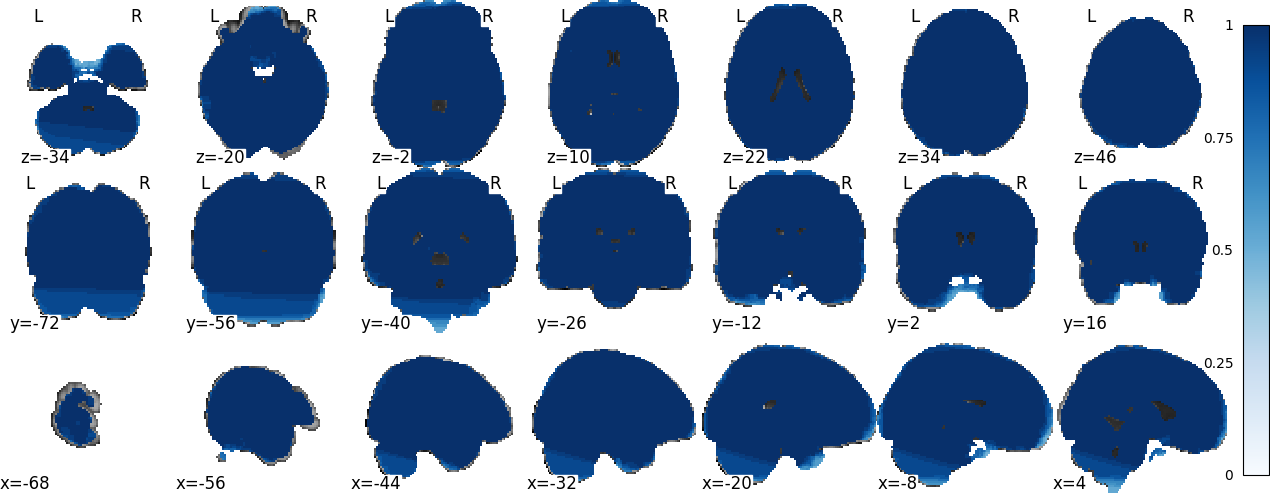
Mask

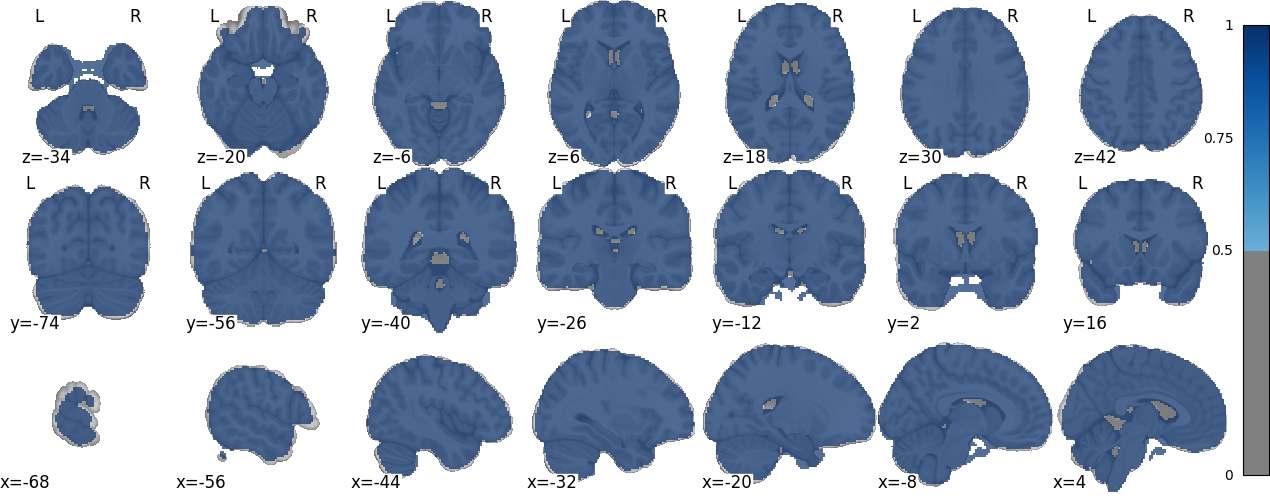
Get figure file: figures/preliminary_dset-1_figure-mask.png

Relative Coverage Map

Get figure file: figures/preliminary_dset-1_figure-relcov.png
Advanced (Percentage of Valid Voxels)

Ridge Plot

Advanced (Summary Statistics)

Similarity of Input Maps

Meta-Analysis

Estimator

Parameters use to fit the meta-analytic estimator.

Corrector

Parameters use to fit the corrector.

Corrected meta-analytic map: z_corr-FDR_method-indep

Explorer

The following figure provides an interactive window to explore the meta-analytic map in detail.

Slice viewer

This panel shows the the corrrected meta-analytic map.

Get figure file: figures/corrector_figure-static.png

Diagnostics

Target image: z_corr-FDR_method-indep

Significant clusters

    X Y Z Peak Stat Cluster Size (mm3)
Tail Cluster ID          
Positive 1 36.00 2.00 6.00 16.77 939424
1a 54.00 -30.00 20.00 16.27
1b 54.00 2.00 2.00 16.15
1c 42.00 12.00 -6.00 15.98
2 20.00 -4.00 -44.00 2.76 216
3 40.00 -22.00 -34.00 2.73 192
4 -48.00 -30.00 -4.00 2.00 88

Label map: positive tail

Get figure file: figures/diagnostics_tail-positive_figure.png

Jackknife

The Jackknife analysis characterizes the relative contribution of each experiment in a meta-analysis to the resulting clusters by looping through experiments, calculating the Estimator's summary statistic for all experiments except the target experiment, dividing the resulting test summary statistics by the summary statistics from the original meta-analysis, and finally averaging the resulting proportion values across all voxels in each cluster.

The heatmap presents the relative contributions of each experiment to each cluster in the thresholded map. There is one row for each experiment, and one column for each cluster, with column names being PostiveTail/NegativeTail indicating the sign (+/-) of the cluster's statistical values. The rows and columns were re-ordered to form clusters in the heatmap.

Heatmap: positive tail

Methods

We kindly ask to report results preprocessed with this tool using the following boilerplate.

An image-based meta-analysis was performed with NiMARE 0.2.2+0.g07ac3b6.dirty (RRID:SCR_017398;
\citealt{Salo2023}) on 21 z-statistic images using the Stouffer method
\citep{stouffer1949american}. False discovery rate correction was performed with the Benjamini-
Hochberg procedure \citep{benjamini1995controlling}.

Bibliography

@article{Salo2023,
  doi = {10.52294/001c.87681},
  url = {https://doi.org/10.52294/001c.87681},
  year = {2023},
  volume = {3},
  pages = {1 - 32},
  author = {Taylor Salo and Tal Yarkoni and Thomas E. Nichols and Jean-Baptiste Poline and Murat Bilgel and Katherine L. Bottenhorn and Dorota Jarecka and James D. Kent and Adam Kimbler and Dylan M. Nielson and Kendra M. Oudyk and Julio A. Peraza and Alexandre Pérez and Puck C. Reeders and Julio A. Yanes and Angela R. Laird},
  title = {NiMARE: Neuroimaging Meta-Analysis Research Environment},
  journal = {Aperture Neuro}
}
@article{benjamini1995controlling,
  title={Controlling the false discovery rate: a practical and powerful approach to multiple testing},
  author={Benjamini, Yoav and Hochberg, Yosef},
  journal={Journal of the Royal statistical society: series B (Methodological)},
  volume={57},
  number={1},
  pages={289--300},
  year={1995},
  publisher={Wiley Online Library},
  url={https://doi.org/10.1111/j.2517-6161.1995.tb02031.x},
  doi={10.1111/j.2517-6161.1995.tb02031.x}
}
@article{stouffer1949american,
  title={The american soldier: Adjustment during army life.(studies in social psychology in world war ii), vol. 1},
  author={Stouffer, Samuel A and Suchman, Edward A and DeVinney, Leland C and Star, Shirley A and Williams Jr, Robin M},
  journal={Studies in social psychology in World War II},
  year={1949},
  publisher={Princeton Univ. Press}
}