Note
Click here to download the full example code
The Corrector class
Here we take a look at multiple comparisons correction in meta-analyses.
import matplotlib.pyplot as plt
import seaborn as sns
from nilearn.plotting import plot_stat_map
Out:
/home/docs/checkouts/readthedocs.org/user_builds/nimare/envs/0.0.12/lib/python3.7/site-packages/seaborn/cm.py:1582: UserWarning: Trying to register the cmap 'rocket' which already exists.
  mpl_cm.register_cmap(_name, _cmap)
/home/docs/checkouts/readthedocs.org/user_builds/nimare/envs/0.0.12/lib/python3.7/site-packages/seaborn/cm.py:1583: UserWarning: Trying to register the cmap 'rocket_r' which already exists.
  mpl_cm.register_cmap(_name + "_r", _cmap_r)
/home/docs/checkouts/readthedocs.org/user_builds/nimare/envs/0.0.12/lib/python3.7/site-packages/seaborn/cm.py:1582: UserWarning: Trying to register the cmap 'mako' which already exists.
  mpl_cm.register_cmap(_name, _cmap)
/home/docs/checkouts/readthedocs.org/user_builds/nimare/envs/0.0.12/lib/python3.7/site-packages/seaborn/cm.py:1583: UserWarning: Trying to register the cmap 'mako_r' which already exists.
  mpl_cm.register_cmap(_name + "_r", _cmap_r)
/home/docs/checkouts/readthedocs.org/user_builds/nimare/envs/0.0.12/lib/python3.7/site-packages/seaborn/cm.py:1582: UserWarning: Trying to register the cmap 'icefire' which already exists.
  mpl_cm.register_cmap(_name, _cmap)
/home/docs/checkouts/readthedocs.org/user_builds/nimare/envs/0.0.12/lib/python3.7/site-packages/seaborn/cm.py:1583: UserWarning: Trying to register the cmap 'icefire_r' which already exists.
  mpl_cm.register_cmap(_name + "_r", _cmap_r)
/home/docs/checkouts/readthedocs.org/user_builds/nimare/envs/0.0.12/lib/python3.7/site-packages/seaborn/cm.py:1582: UserWarning: Trying to register the cmap 'vlag' which already exists.
  mpl_cm.register_cmap(_name, _cmap)
/home/docs/checkouts/readthedocs.org/user_builds/nimare/envs/0.0.12/lib/python3.7/site-packages/seaborn/cm.py:1583: UserWarning: Trying to register the cmap 'vlag_r' which already exists.
  mpl_cm.register_cmap(_name + "_r", _cmap_r)
/home/docs/checkouts/readthedocs.org/user_builds/nimare/envs/0.0.12/lib/python3.7/site-packages/seaborn/cm.py:1582: UserWarning: Trying to register the cmap 'flare' which already exists.
  mpl_cm.register_cmap(_name, _cmap)
/home/docs/checkouts/readthedocs.org/user_builds/nimare/envs/0.0.12/lib/python3.7/site-packages/seaborn/cm.py:1583: UserWarning: Trying to register the cmap 'flare_r' which already exists.
  mpl_cm.register_cmap(_name + "_r", _cmap_r)
/home/docs/checkouts/readthedocs.org/user_builds/nimare/envs/0.0.12/lib/python3.7/site-packages/seaborn/cm.py:1582: UserWarning: Trying to register the cmap 'crest' which already exists.
  mpl_cm.register_cmap(_name, _cmap)
/home/docs/checkouts/readthedocs.org/user_builds/nimare/envs/0.0.12/lib/python3.7/site-packages/seaborn/cm.py:1583: UserWarning: Trying to register the cmap 'crest_r' which already exists.
  mpl_cm.register_cmap(_name + "_r", _cmap_r)
Download data
from nimare.extract import download_nidm_pain

dset_dir = download_nidm_pain()
Load Dataset
import os

from nimare.dataset import Dataset
from nimare.utils import get_resource_path

dset_file = os.path.join(get_resource_path(), "nidm_pain_dset.json")
dset = Dataset(dset_file)
dset.update_path(dset_dir)

mask_img = dset.masker.mask_img
Multiple comparisons correction in coordinate-based meta-analyses
Tip
For more information multiple comparisons correction and CBMA in NiMARE, see Multiple comparisons correction.
from nimare.meta.cbma.ale import ALE

# First, we need to fit the Estimator to the Dataset.
meta = ALE(null_method="approximate")
results = meta.fit(dset)

# We can check which FWE correction methods are available for the ALE Estimator
# with the ``inspect`` class method.
from nimare.correct import FWECorrector

print(FWECorrector.inspect(results))
Out:
['bonferroni', 'montecarlo']
Apply the Corrector to the MetaResult
Now that we know what FWE correction methods are available, we can use one.
The “montecarlo” method is a special one that is implemented within the Estimator, rather than in the Corrector.
corr = FWECorrector(method="montecarlo", n_iters=50, n_cores=2)
cres = corr.transform(results)
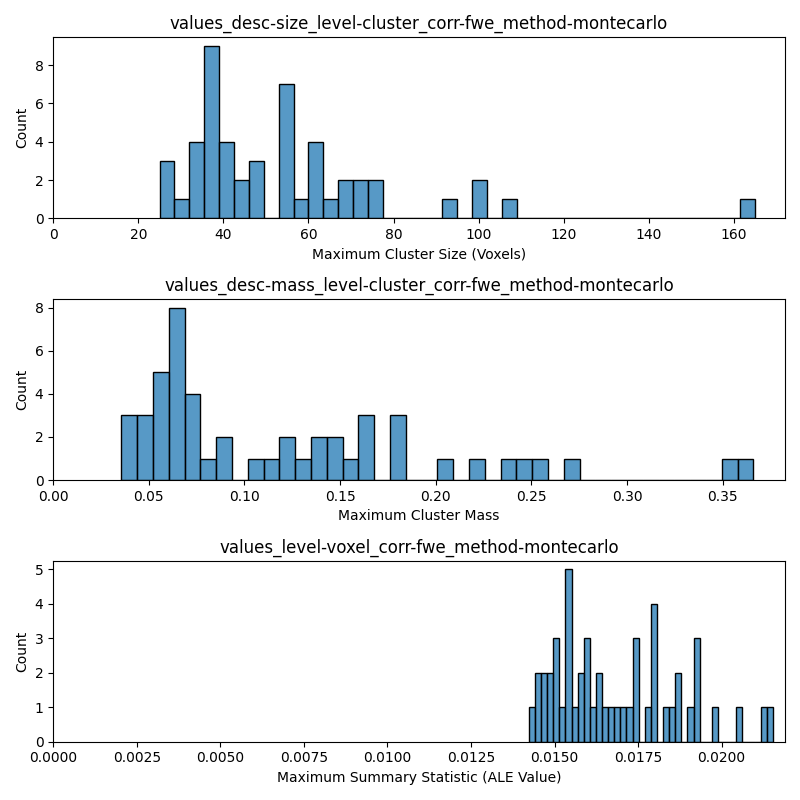
DISTS_TO_PLOT = [
"values_desc-size_level-cluster_corr-fwe_method-montecarlo",
"values_desc-mass_level-cluster_corr-fwe_method-montecarlo",
"values_level-voxel_corr-fwe_method-montecarlo",
]
XLABELS = [
"Maximum Cluster Size (Voxels)",
"Maximum Cluster Mass",
"Maximum Summary Statistic (ALE Value)",
]
fig, axes = plt.subplots(figsize=(8, 8), nrows=3)
null_dists = cres.estimator.null_distributions_
for i_ax, dist_name in enumerate(DISTS_TO_PLOT):
xlabel = XLABELS[i_ax]
sns.histplot(x=null_dists[dist_name], bins=40, ax=axes[i_ax])
axes[i_ax].set_title(dist_name)
axes[i_ax].set_xlabel(xlabel)
axes[i_ax].set_xlim(0, None)
fig.tight_layout()
Out:
  0%|          | 0/50 [00:00<?, ?it/s]
  2%|2         | 1/50 [00:05<04:18,  5.27s/it]
  4%|4         | 2/50 [00:05<01:47,  2.24s/it]
  6%|6         | 3/50 [00:06<01:16,  1.62s/it]
  8%|8         | 4/50 [00:06<00:47,  1.04s/it]
 10%|#         | 5/50 [00:07<00:41,  1.07it/s]
 12%|#2        | 6/50 [00:07<00:29,  1.49it/s]
 14%|#4        | 7/50 [00:08<00:31,  1.37it/s]
 16%|#6        | 8/50 [00:08<00:23,  1.81it/s]
 18%|#8        | 9/50 [00:09<00:24,  1.67it/s]
 20%|##        | 10/50 [00:09<00:18,  2.13it/s]
 22%|##2       | 11/50 [00:10<00:22,  1.73it/s]
 24%|##4       | 12/50 [00:10<00:17,  2.17it/s]
 26%|##6       | 13/50 [00:10<00:19,  1.87it/s]
 28%|##8       | 14/50 [00:11<00:15,  2.33it/s]
 30%|###       | 15/50 [00:11<00:19,  1.82it/s]
 32%|###2      | 16/50 [00:12<00:15,  2.20it/s]
 34%|###4      | 17/50 [00:12<00:16,  1.97it/s]
 36%|###6      | 18/50 [00:13<00:13,  2.30it/s]
 38%|###8      | 19/50 [00:13<00:16,  1.91it/s]
 40%|####      | 20/50 [00:14<00:13,  2.22it/s]
 42%|####2     | 21/50 [00:14<00:14,  2.01it/s]
 44%|####4     | 22/50 [00:14<00:12,  2.32it/s]
 46%|####6     | 23/50 [00:15<00:14,  1.90it/s]
 48%|####8     | 24/50 [00:15<00:11,  2.24it/s]
 50%|#####     | 25/50 [00:16<00:12,  1.97it/s]
 52%|#####2    | 26/50 [00:16<00:10,  2.34it/s]
 54%|#####4    | 27/50 [00:17<00:12,  1.87it/s]
 56%|#####6    | 28/50 [00:17<00:10,  2.17it/s]
 58%|#####8    | 29/50 [00:18<00:10,  1.99it/s]
 60%|######    | 30/50 [00:18<00:08,  2.28it/s]
 62%|######2   | 31/50 [00:19<00:09,  1.93it/s]
 64%|######4   | 32/50 [00:19<00:08,  2.15it/s]
 66%|######6   | 33/50 [00:20<00:08,  2.02it/s]
 68%|######8   | 34/50 [00:20<00:07,  2.27it/s]
 70%|#######   | 35/50 [00:21<00:07,  1.97it/s]
 72%|#######2  | 36/50 [00:21<00:06,  2.20it/s]
 74%|#######4  | 37/50 [00:22<00:06,  2.12it/s]
 76%|#######6  | 38/50 [00:22<00:05,  2.23it/s]
 78%|#######8  | 39/50 [00:23<00:05,  2.06it/s]
 80%|########  | 40/50 [00:23<00:04,  2.11it/s]
 82%|########2 | 41/50 [00:24<00:04,  2.18it/s]
 84%|########4 | 42/50 [00:24<00:03,  2.19it/s]
 86%|########6 | 43/50 [00:25<00:03,  2.03it/s]
 88%|########8 | 44/50 [00:25<00:02,  2.09it/s]
 90%|######### | 45/50 [00:26<00:02,  2.14it/s]
 92%|#########2| 46/50 [00:26<00:01,  2.18it/s]
 94%|#########3| 47/50 [00:27<00:01,  2.03it/s]
 96%|#########6| 48/50 [00:27<00:00,  2.07it/s]
 98%|#########8| 49/50 [00:27<00:00,  2.19it/s]
100%|##########| 50/50 [00:28<00:00,  2.36it/s]
100%|##########| 50/50 [00:28<00:00,  1.76it/s]
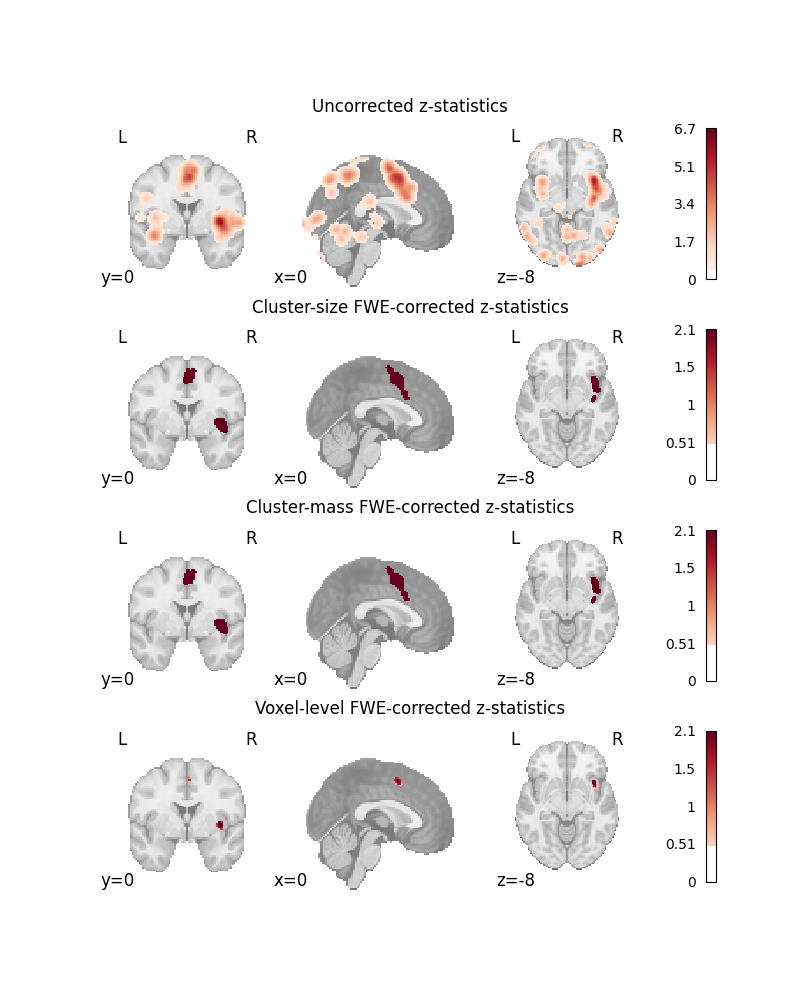
Show corrected results
MAPS_TO_PLOT = [
    "z",
    "z_desc-size_level-cluster_corr-FWE_method-montecarlo",
    "z_desc-mass_level-cluster_corr-FWE_method-montecarlo",
    "z_level-voxel_corr-FWE_method-montecarlo",
]
TITLES = [
    "Uncorrected z-statistics",
    "Cluster-size FWE-corrected z-statistics",
    "Cluster-mass FWE-corrected z-statistics",
    "Voxel-level FWE-corrected z-statistics",
]

fig, axes = plt.subplots(figsize=(8, 10), nrows=4)

for i_ax, map_name in enumerate(MAPS_TO_PLOT):
    title = TITLES[i_ax]
    plot_stat_map(
        cres.get_map(map_name),
        draw_cross=False,
        cmap="RdBu_r",
        threshold=0.5,
        cut_coords=[0, 0, -8],
        figure=fig,
        axes=axes[i_ax],
    )
    axes[i_ax].set_title(title)
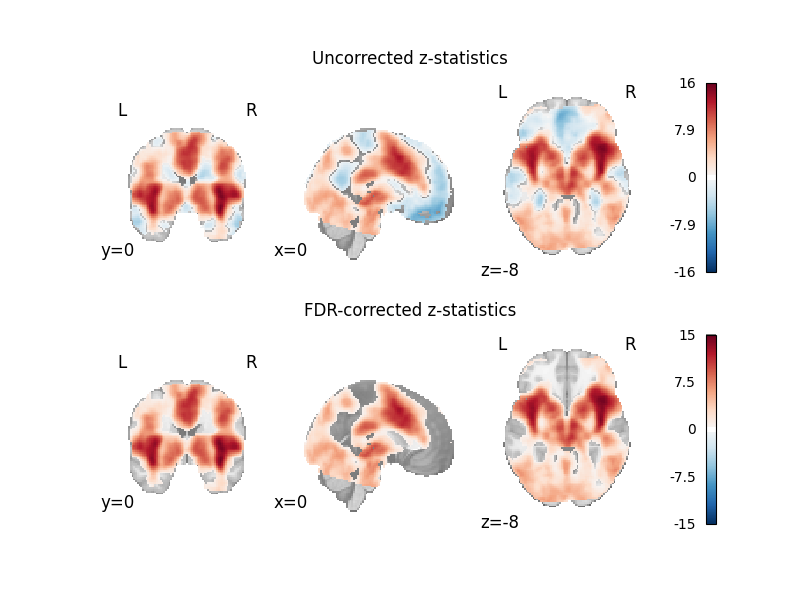
Multiple comparisons correction in image-based meta-analyses
from nimare.correct import FDRCorrector
from nimare.meta.ibma import Stouffers

meta = Stouffers(resample=True)
results = meta.fit(dset)
print(f"FWECorrector options: {FWECorrector.inspect(results)}")
print(f"FDRCorrector options: {FDRCorrector.inspect(results)}")
Out:
FWECorrector options: ['bonferroni']
FDRCorrector options: ['indep', 'negcorr']
Note that the FWECorrector does not support a “montecarlo” method for the Stouffers Estimator. This is because NiMARE does not have a Monte Carlo-based method implemented for most IBMA algorithms.
Apply the Corrector to the MetaResult
corr = FDRCorrector(method="indep", alpha=0.05)
cres = corr.transform(results)
Show corrected results
fig, axes = plt.subplots(figsize=(8, 6), nrows=2)
plot_stat_map(
    cres.get_map("z"),
    draw_cross=False,
    cmap="RdBu_r",
    threshold=0.5,
    cut_coords=[0, 0, -8],
    figure=fig,
    axes=axes[0],
)
axes[0].set_title("Uncorrected z-statistics")
plot_stat_map(
    cres.get_map("z_corr-FDR_method-indep"),
    draw_cross=False,
    cmap="RdBu_r",
    threshold=0.5,
    cut_coords=[0, 0, -8],
    figure=fig,
    axes=axes[1],
)
axes[1].set_title("FDR-corrected z-statistics")
Out:
/home/docs/checkouts/readthedocs.org/user_builds/nimare/envs/0.0.12/lib/python3.7/site-packages/nilearn/_utils/niimg.py:62: UserWarning: Non-finite values detected. These values will be replaced with zeros.
  "Non-finite values detected. "

Text(0.5, 1.0, 'FDR-corrected z-statistics')
Total running time of the script: ( 0 minutes 44.064 seconds)