Note
Go to the end to download the full example code.
The Corrector class
Here we take a look at multiple comparisons correction in meta-analyses.
from pprint import pprint

import matplotlib.pyplot as plt
import seaborn as sns
from nilearn.plotting import plot_stat_map
Download data
from nimare.extract import download_nidm_pain

dset_dir = download_nidm_pain()
Load Studyset
import os

from nimare.nimads import Studyset
from nimare.utils import get_resource_path

studyset_file = os.path.join(get_resource_path(), "nidm_pain_studyset.json")
studyset = Studyset(studyset_file, target="mni152_2mm")
studyset.update_path(dset_dir)
'<Studyset: nimads_from_dataset>'
Multiple comparisons correction in coordinate-based meta-analyses
Tip
For more information multiple comparisons correction and CBMA in NiMARE, see Multiple comparisons correction.
from nimare.meta.cbma.ale import ALE

# First, we need to fit the Estimator to the Studyset.
meta = ALE(null_method="approximate")
results = meta.fit(studyset)

# We can check which FWE correction methods are available for the ALE Estimator
# with the ``inspect`` class method.
from nimare.correct import FWECorrector

print(FWECorrector.inspect(results))
['bonferroni', 'montecarlo', 'predictive']
Apply the Corrector to the MetaResult
Now that we know what FWE correction methods are available, we can use one.
The “montecarlo” method is a special one that is implemented within the Estimator, rather than in the Corrector.
corr = FWECorrector(method="montecarlo", n_iters=50, n_cores=2)
cres = corr.transform(results)
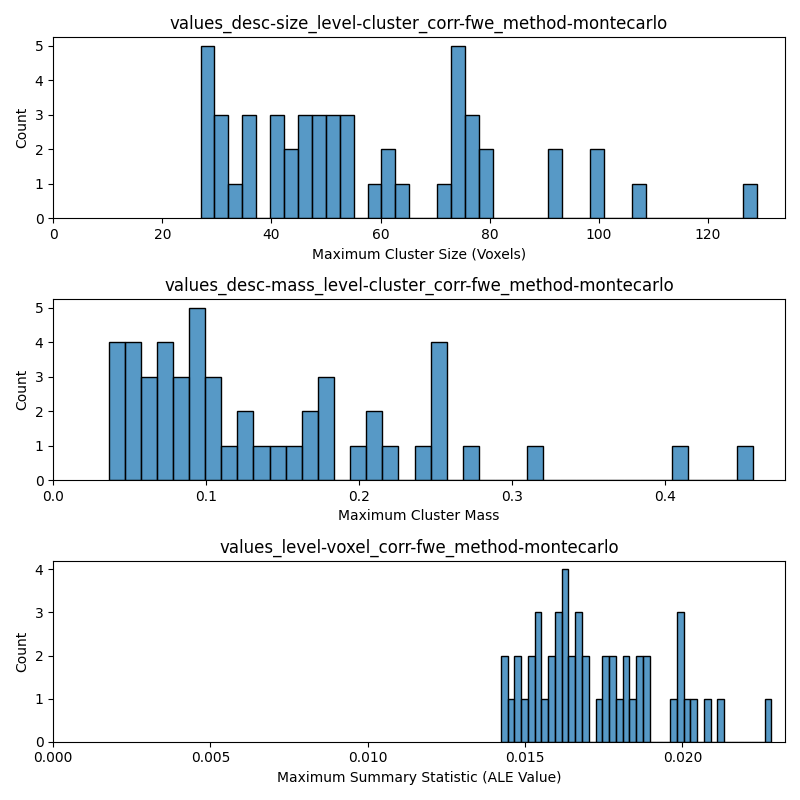
DISTS_TO_PLOT = [
"values_desc-size_level-cluster_corr-fwe_method-montecarlo",
"values_desc-mass_level-cluster_corr-fwe_method-montecarlo",
"values_level-voxel_corr-fwe_method-montecarlo",
]
XLABELS = [
"Maximum Cluster Size (Voxels)",
"Maximum Cluster Mass",
"Maximum Summary Statistic (ALE Value)",
]
fig, axes = plt.subplots(figsize=(8, 8), nrows=3)
null_dists = cres.estimator.null_distributions_
for i_ax, dist_name in enumerate(DISTS_TO_PLOT):
xlabel = XLABELS[i_ax]
sns.histplot(x=null_dists[dist_name], bins=40, ax=axes[i_ax])
axes[i_ax].set_title(dist_name)
axes[i_ax].set_xlabel(xlabel)
axes[i_ax].set_xlim(0, None)
fig.tight_layout()
  0%|          | 0/50 [00:00<?, ?it/s]
  2%|▏         | 1/50 [00:00<00:05,  8.90it/s]
  6%|▌         | 3/50 [00:00<00:03, 14.83it/s]
 14%|█▍        | 7/50 [00:00<00:02, 18.21it/s]
 18%|█▊        | 9/50 [00:00<00:02, 18.43it/s]
 24%|██▍       | 12/50 [00:00<00:01, 21.60it/s]
 30%|███       | 15/50 [00:00<00:01, 19.09it/s]
 34%|███▍      | 17/50 [00:00<00:01, 19.15it/s]
 38%|███▊      | 19/50 [00:01<00:01, 19.14it/s]
 44%|████▍     | 22/50 [00:01<00:01, 21.94it/s]
 50%|█████     | 25/50 [00:01<00:01, 19.45it/s]
 56%|█████▌    | 28/50 [00:01<00:01, 21.17it/s]
 62%|██████▏   | 31/50 [00:01<00:00, 19.24it/s]
 68%|██████▊   | 34/50 [00:01<00:00, 21.48it/s]
 74%|███████▍  | 37/50 [00:01<00:00, 19.05it/s]
 80%|████████  | 40/50 [00:02<00:00, 21.33it/s]
 86%|████████▌ | 43/50 [00:02<00:00, 18.91it/s]
 92%|█████████▏| 46/50 [00:02<00:00, 21.19it/s]
 98%|█████████▊| 49/50 [00:02<00:00, 18.45it/s]
100%|██████████| 50/50 [00:02<00:00, 19.77it/s]
You can also look at the description of the Corrector.
print("Description:")
pprint(cres.description_)
print("References:")
pprint(cres.bibtex_)
Description:
('An activation likelihood estimation (ALE) meta-analysis '
 '\\citep{turkeltaub2002meta,turkeltaub2012minimizing,eickhoff2012activation} '
 'was performed with NiMARE 0.20.0 (RRID:SCR_017398; \\citealt{Salo2023}), '
 'using a(n) ALE kernel. An ALE kernel \\citep{eickhoff2012activation} was '
 'used to generate study-wise modeled activation maps from coordinates. In '
 'this kernel method, each coordinate is convolved with a Gaussian kernel with '
 'full-width at half max values determined on a study-wise basis based on the '
 'study sample sizes according to the formulae provided in '
 '\\cite{eickhoff2012activation}. For voxels with overlapping kernels, the '
 'maximum value was retained. ALE values were converted to p-values using an '
 'approximate null distribution \\citep{eickhoff2012activation}. The input '
 'dataset included 267 foci from 21 experiments, with a total of 334 '
 'participants. Family-wise error rate correction was performed using a Monte '
 'Carlo procedure. In this procedure, null datasets are generated in which '
 'dataset coordinates are substituted with coordinates randomly drawn from the '
 'meta-analysis mask, and maximum values are retained. This procedure was '
 'repeated 50 times to build null distributions of summary statistics, cluster '
 'sizes, and cluster masses. Clusters for cluster-level correction were '
 'defined using edge-wise connectivity and a voxel-level threshold of p < '
 '0.001 from the uncorrected null distribution.')
References:
('@article{Salo2023,\n'
 '  doi = {10.52294/001c.87681},\n'
 '  url = {https://doi.org/10.52294/001c.87681},\n'
 '  year = {2023},\n'
 '  volume = {3},\n'
 '  pages = {1 - 32},\n'
 '  author = {Taylor Salo and Tal Yarkoni and Thomas E. Nichols and '
 'Jean-Baptiste Poline and Murat Bilgel and Katherine L. Bottenhorn and Dorota '
 'Jarecka and James D. Kent and Adam Kimbler and Dylan M. Nielson and Kendra '
 'M. Oudyk and Julio A. Peraza and Alexandre Pérez and Puck C. Reeders and '
 'Julio A. Yanes and Angela R. Laird},\n'
 '  title = {NiMARE: Neuroimaging Meta-Analysis Research Environment},\n'
 '  journal = {Aperture Neuro}\n'
 '}\n'
 '@article{eickhoff2012activation,\n'
 '  title={Activation likelihood estimation meta-analysis revisited},\n'
 '  author={Eickhoff, Simon B and Bzdok, Danilo and Laird, Angela R and Kurth, '
 'Florian and Fox, Peter T},\n'
 '  journal={Neuroimage},\n'
 '  volume={59},\n'
 '  number={3},\n'
 '  pages={2349--2361},\n'
 '  year={2012},\n'
 '  publisher={Elsevier},\n'
 '  url={https://doi.org/10.1016/j.neuroimage.2011.09.017},\n'
 '  doi={10.1016/j.neuroimage.2011.09.017}\n'
 '}\n'
 '@article{turkeltaub2002meta,\n'
 '  title={Meta-analysis of the functional neuroanatomy of single-word '
 'reading: method and validation},\n'
 '  author={Turkeltaub, Peter E and Eden, Guinevere F and Jones, Karen M and '
 'Zeffiro, Thomas A},\n'
 '  journal={Neuroimage},\n'
 '  volume={16},\n'
 '  number={3},\n'
 '  pages={765--780},\n'
 '  year={2002},\n'
 '  publisher={Elsevier},\n'
 '  url={https://doi.org/10.1006/nimg.2002.1131},\n'
 '  doi={10.1006/nimg.2002.1131}\n'
 '}\n'
 '@article{turkeltaub2012minimizing,\n'
 '  title={Minimizing within-experiment and within-group effects in activation '
 'likelihood estimation meta-analyses},\n'
 '  author={Turkeltaub, Peter E and Eickhoff, Simon B and Laird, Angela R and '
 'Fox, Mick and Wiener, Martin and Fox, Peter},\n'
 '  journal={Human brain mapping},\n'
 '  volume={33},\n'
 '  number={1},\n'
 '  pages={1--13},\n'
 '  year={2012},\n'
 '  publisher={Wiley Online Library},\n'
 '  url={https://doi.org/10.1002/hbm.21186},\n'
 '  doi={10.1002/hbm.21186}\n'
 '}')
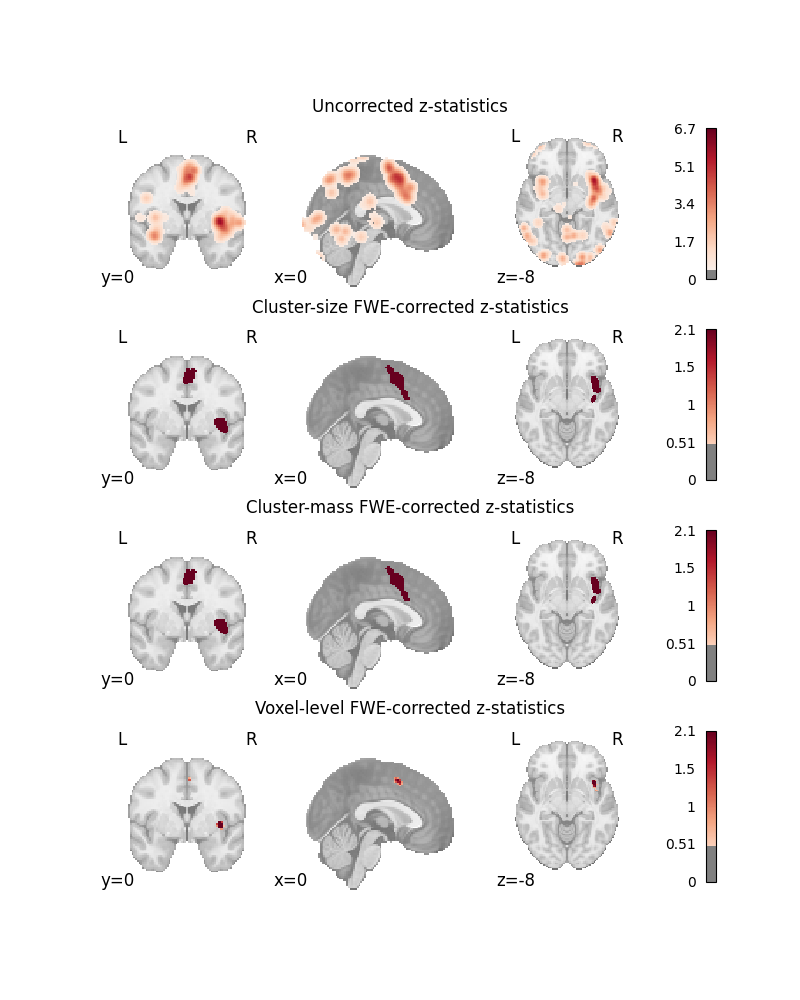
Show corrected results
MAPS_TO_PLOT = [
    "z",
    "z_desc-size_level-cluster_corr-FWE_method-montecarlo",
    "z_desc-mass_level-cluster_corr-FWE_method-montecarlo",
    "z_level-voxel_corr-FWE_method-montecarlo",
]
TITLES = [
    "Uncorrected z-statistics",
    "Cluster-size FWE-corrected z-statistics",
    "Cluster-mass FWE-corrected z-statistics",
    "Voxel-level FWE-corrected z-statistics",
]

fig, axes = plt.subplots(figsize=(8, 10), nrows=4)

for i_ax, map_name in enumerate(MAPS_TO_PLOT):
    title = TITLES[i_ax]
    plot_stat_map(
        cres.get_map(map_name),
        draw_cross=False,
        cmap="RdBu_r",
        symmetric_cbar=True,
        threshold=0.5,
        cut_coords=[0, 0, -8],
        figure=fig,
        axes=axes[i_ax],
    )
    axes[i_ax].set_title(title)
Multiple comparisons correction in image-based meta-analyses
from nimare.correct import FDRCorrector
from nimare.meta.ibma import Stouffers

meta = Stouffers(resample=True)
results = meta.fit(studyset)
print(f"FWECorrector options: {FWECorrector.inspect(results)}")
print(f"FDRCorrector options: {FDRCorrector.inspect(results)}")
/home/docs/checkouts/readthedocs.org/user_builds/nimare/envs/stable/lib/python3.13/site-packages/numpy/_core/numeric.py:386: RuntimeWarning: invalid value encountered in cast
  multiarray.copyto(a, fill_value, casting='unsafe')
FWECorrector options: ['bonferroni']
FDRCorrector options: ['indep', 'negcorr']
Note that the FWECorrector does not support a “montecarlo” method for the Stouffers Estimator. This is because NiMARE does not have a Monte Carlo-based method implemented for most IBMA algorithms.
Apply the Corrector to the MetaResult
corr = FDRCorrector(method="indep", alpha=0.05)
cres = corr.transform(results)
/home/docs/checkouts/readthedocs.org/user_builds/nimare/checkouts/stable/nimare/transforms.py:865: RuntimeWarning: invalid value encountered in divide
  z = stats.norm.isf(p / 2)
Show corrected results
fig, axes = plt.subplots(figsize=(8, 6), nrows=2)
plot_stat_map(
    cres.get_map("z"),
    draw_cross=False,
    cmap="RdBu_r",
    symmetric_cbar=True,
    threshold=0.5,
    cut_coords=[0, 0, -8],
    figure=fig,
    axes=axes[0],
)
axes[0].set_title("Uncorrected z-statistics")
plot_stat_map(
    cres.get_map("z_corr-FDR_method-indep"),
    draw_cross=False,
    cmap="RdBu_r",
    symmetric_cbar=True,
    threshold=0.5,
    cut_coords=[0, 0, -8],
    figure=fig,
    axes=axes[1],
)
axes[1].set_title("FDR-corrected z-statistics")
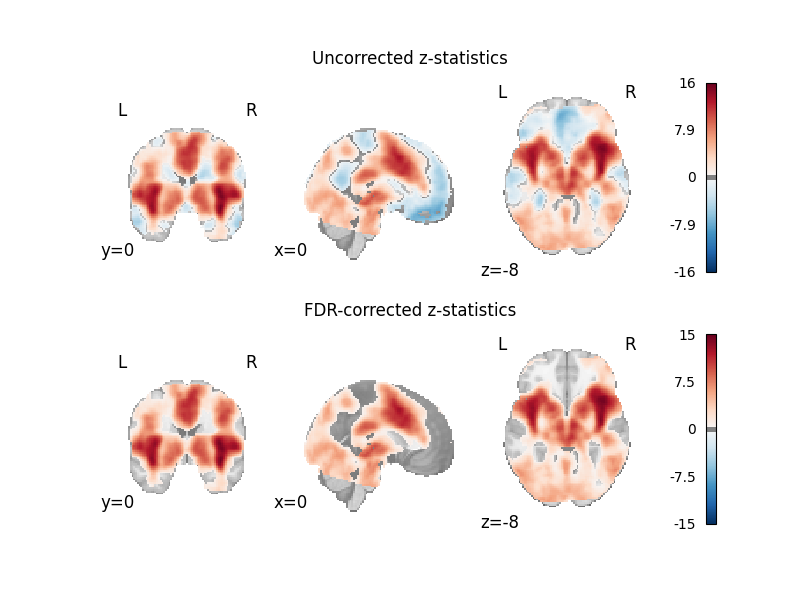
Text(0.5, 1.0, 'FDR-corrected z-statistics')
Total running time of the script: (0 minutes 6.578 seconds)